for expert insights on the most pressing topics financial professionals are facing today.
Learn MoreNot too long ago we published a blog post titled, Breathe Life into Your Marketing Efforts with Video.
In it, we laid out the reasons why advisors should use video in their marketing strategies. And we backed it up with some pretty compelling statistics that showed you how effective video can be.
What it boiled down to is this: potential clients pay more attention to your business if you use video.
Obviously, that’s a really important marketing lesson. And while our blog post and accompanying promotional video received decent traffic, a little part of us knew we could do more to prove how great video is.
So we decided to put our money where our mouth is.
We ran a test to see what kind of impact visual content would have on our email campaign to advisors. And now that the results are in, we wanted to share them with you.
Full disclosure: this isn’t for bragging rights. It’s simply meant to show you a real-world example of how video engages more people. Let’s dive in.
At eMoney we use marketing automation software that allows us to send two different versions of the same email. Using this approach, we could see whether or not visual content actually impacted engagement.
Here are the two versions we sent to advisors:
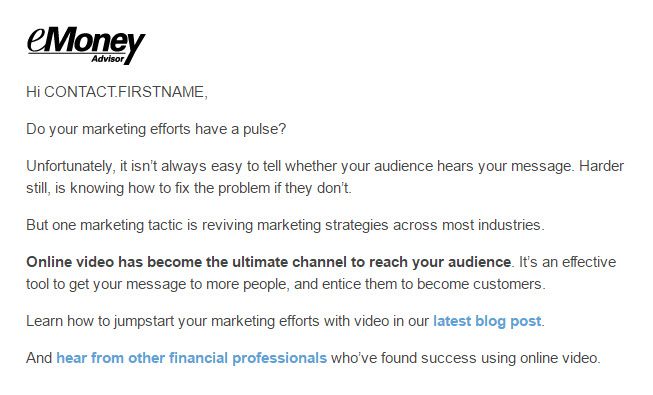
Version A
Version B
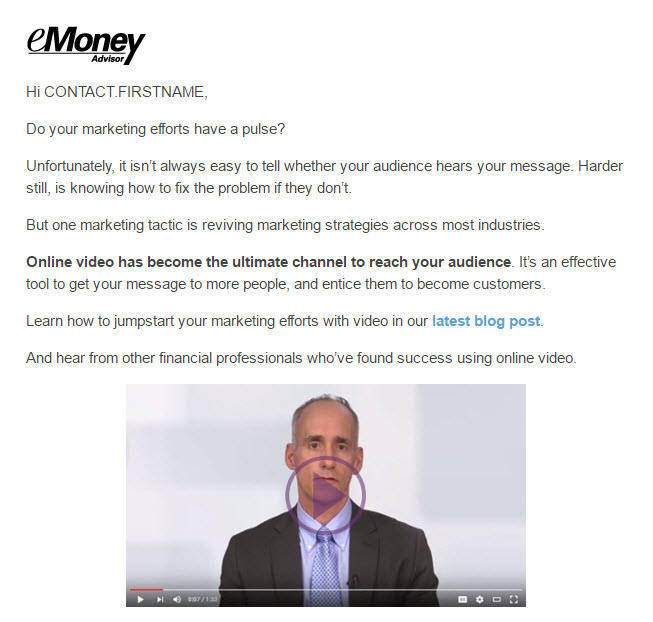
As you can see, Version A is a plain-text email with hyperlinks to both the blog post and our promotional video. Version B used the same plain-text copy, but replaced the hyperlink to the video with an image.
We sent both versions of the email to the same number of advisors. And as it turns out, almost the same number of advisors opened each version, by a difference of about 3%.
Do you want to take a wild guess as to which version had better engagement?
Version A, without the image, had a 16.8% click rate. While Version B received a 67.6% click rate.
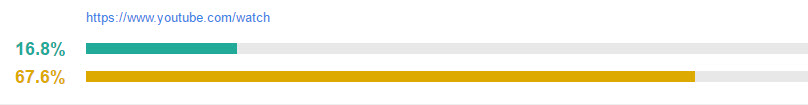
Clearly, the visual content in Version B enticed those advisors to engage with us further. Plus, by watching the video, these advisors learned more about our services.
Some of those advisors even requested more information from us. At the time of writing this post, our Advisor Branded Media sign-up form hovers around a 20% submission rate. While average rates vary by industry, it’s widely believed that anything over 10% is a success. *High-fives self*
Imagine applying this technique to your marketing efforts. What kind of growth would you experience if more people consumed your content and learned about your services? How many more conversations would you have? How many more referrals?
I admit, this test was not perfect. While it was a good indicator of the kind of impact video has on audience engagement, there are still some variables we have yet to measure. And some techniques we’ll want to try for future emails. However, digital marketing is about improving what came before. And using this technique, we were able to reach more people with a message they may not have heard otherwise.
If you’d like to learn more about our video marketing services, and all the ways it can elevate your message, subscribe to our Advisor Branded Media. Or if you’d like to see more of our video content, visit our YouTube channel.