
This month’s enhancements focus on improving the Decision Center planning experience by adding Monte Carlo functionality to the Cash Flow reports and printable versions of some of your favorite reports like Asset Spread and Cash Flow – Expenses.
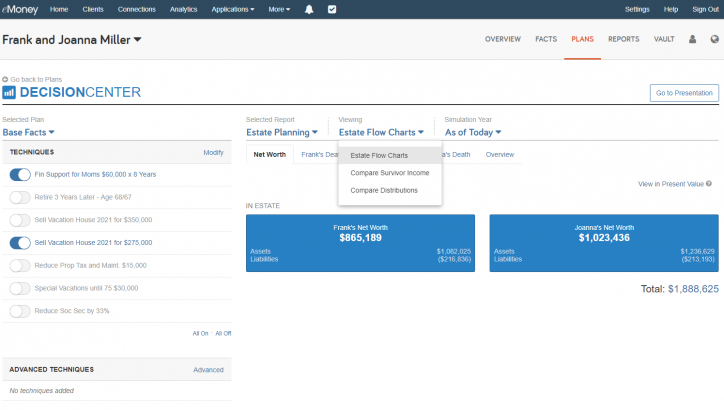
We’ve also consolidated access to our interactive estate planning reports through the Distribution Center tile on the Plans page, all the reports you know and love live on under Decision Center – Estate Planning.
Join us for our December Product Update webinar on December 29th, or keep reading below to check out these enhancements and learn more about some essential updates coming soon to the Client Site next year!
Interested in what’s coming next to eMoney? Sign up for our Product Vision webinar on December 9th at 2:00 p.m. ET.
As part of our strategic vision to make Decision Center the industry’s most comprehensive and interactive planning experience, earlier this year, we added all of our interactive estate planning reports to the Decision Center—streamlining how you navigate between a cash-flow and estate planning conversation by removing the need to switch back and forth between the Decision Center and Distribution Center.
With this update, we removed the Distribution Center green access tile on the Plans page. The Decision Center is now your main hub to continue to access estate planning reports.

It’s important to note that with this change, we’re merely aligning all access to the interactive estate planning reports through the Decision Center and you will not lose any estate planning functionality.
Planning Enhancements
Learn more about our strategic vision for Decision Center in this video or keep reading below for details on all upcoming releases. Stay tuned for more enhancements to the Decision Center next year, as we begin to unify the full breadth and depth of eMoney’s planning capabilities.
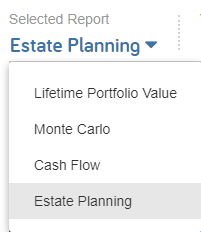
Open the Decision Center and click on the Selected Report drop-down menu. Then, click Estate Planning to launch the reports.
Once selected, you can easily switch your view between Estate Flow Charts, Compare Distributions, and Compare Survivor Income with the Viewing drop-down menu.
We’re bringing the same robust Monte Carlo functionality recently released for our Decision Center lifetime portfolio value chart, to your cash flow reports!
Your Cash Flow pages within Decision Center now have the option to show the total portfolio assets for a single Monte Carlo trial. This allows advisors to show what the cash flow might look like in an above-average market (80th percentile), average market (50th percentile), below-average market (20th percentile), or a custom percentile.

Cash flow charts updated with Monte Carlo functionality include:
We’ve added printable versions of our most popular Decision Center reports— Asset Spread, Cash-Flow Overview, Cash-Flow Expenses, and Other Income.
All of these reports include two printable versions, one for base facts and one that contains techniques made in Decision Center.
Keep reading below for more details on these charts.

This report shows the potential portfolio asset values for the below-average market (20th percentile), average market (50th percentile), and above-average market (80th percentile) projections over time. The printable report will include an asset spread chart, as well as a corresponding data table showing the year-by-year asset spread projection detail.
Depending on the client plan, this report can include the following information:
Asset spread will have two printable reports, one for base facts and one that adjusts to accommodate the Decision Center plan settings.

The Cash Flow Overview report shows an overview of expenses, compared to the funding sources, year by year and helps to inform clients if their funding sources can cover expenses in future years.
Depending on the client plan, the data table can include the following data:

The Cash Flow Expenses report is a detailed view of expenses, showing a breakdown of expenses year by year.
Depending on the client plan, this report can include the following data:

The Cash Flow Other Income report is a detailed view of other income sources, year by year.
Depending on the client plan, this report can include the following data:
Stay tuned for even more Decision Center enhancements next year!
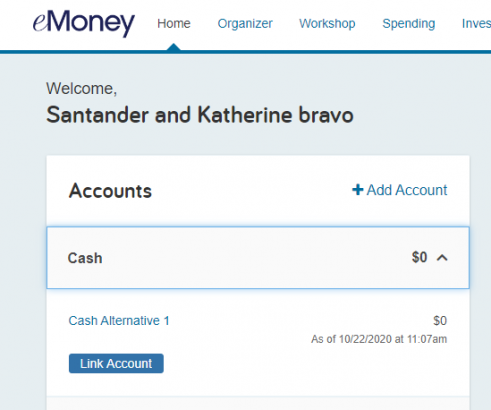
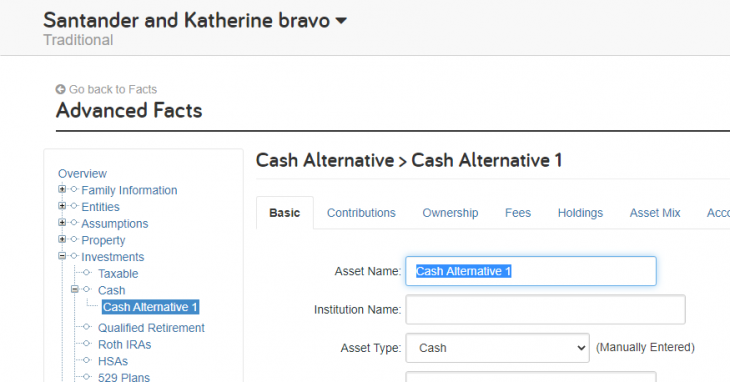
Based on user feedback and to provide clarity around this account type, we renamed the Cash Equivalent account type to Cash Alternative. This change is reflected everywhere cash equivalents are referenced on both the Advisor and Client Portals.
Released December 8, 2020
We’re enhancing eMoney’s Marketing Solution campaign analytics to provide more insight into campaign effectiveness and performance. In this first update to Campaign Analytics, you’ll be able to see email engagement from all campaigns in one comprehensive list. With this view, you can see all campaign emails that were delivered, opened, clicked, bounced, and unsubscribed—providing a better understanding of who is engaging with your campaigns.
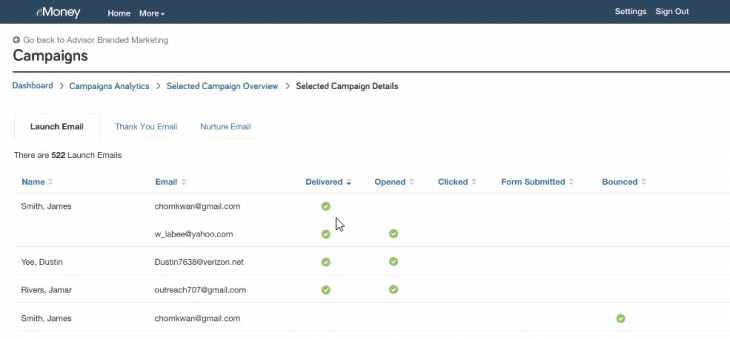
Stay tuned for additional updates in the new year, including deeper insight into landing page visits, leads, and opportunities.
Released December 8, 2020
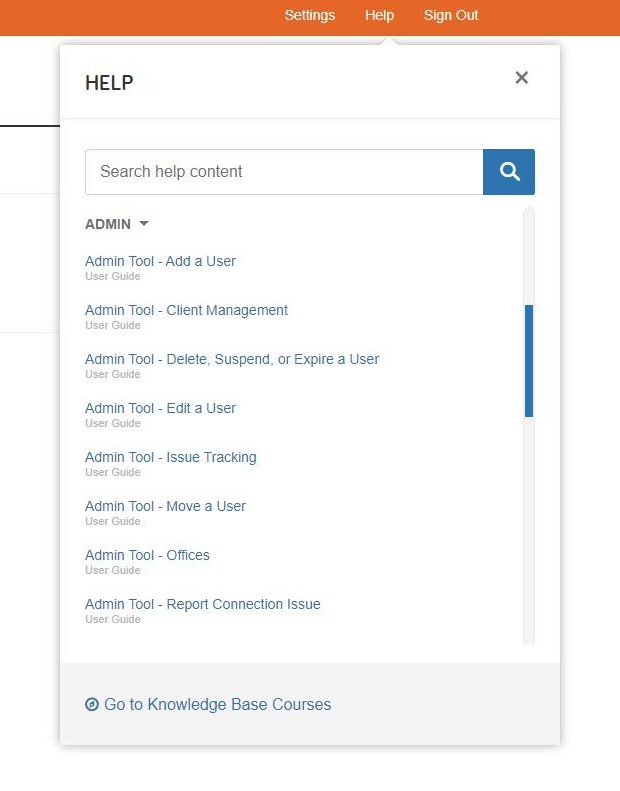
We added new Knowledge Base resources for eMoney Admin users. These new resources provide real-time answers to essential questions regarding eMoney Admin features and will be available within the Admin dashboard.
This includes step-by-step guidance in the form of how-tos that show—not tell—you how to navigate their admin access and complete critical tasks within the tool.
The eMoney Admin user role provides offices with the tools needed to independently manage the administrative and managerial-level functionality. The Knowledge Base resources will be available to the following licensed users:
Check out a preview of some of these helpful new resources below.
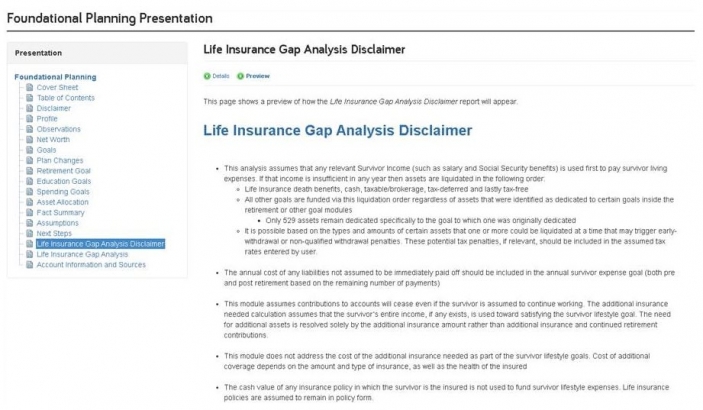
A new disclaimer page has been added to the Foundational Planning – Life Insurance Gap Analysis presentation. The disclaimer will provide context on the assumptions used within the analysis.
Based on user feedback, we are changing the behavior of our growth rate assumptions only in the case of a premature client death being assumed. This change will more realistically model what was considered typical client behavior in such a circumstance.
When a premature death is assumed for someone that is not yet retired, we will continue to use the pre-retirement growth rate until the survivor’s retirement age, when it then switches to the retirement growth rate.
Currently, the asset growth rate switched to the retirement growth rate immediately upon the assumed premature client death. This will, for most cases, result in a higher growth rate for the survivor’s pre-retirement years and thus a smaller life insurance gap analysis need than previously calculated.
To support accurate planning calculations, federal tax-related values and contribution limits will be updated to their 2021 values on January 4, 2021.