
for expert insights on the most pressing topics financial professionals are facing today.
Learn MoreEarlier this month, we released the Presentations chart – the first in a series of planning-focused charts developed based on your feedback.
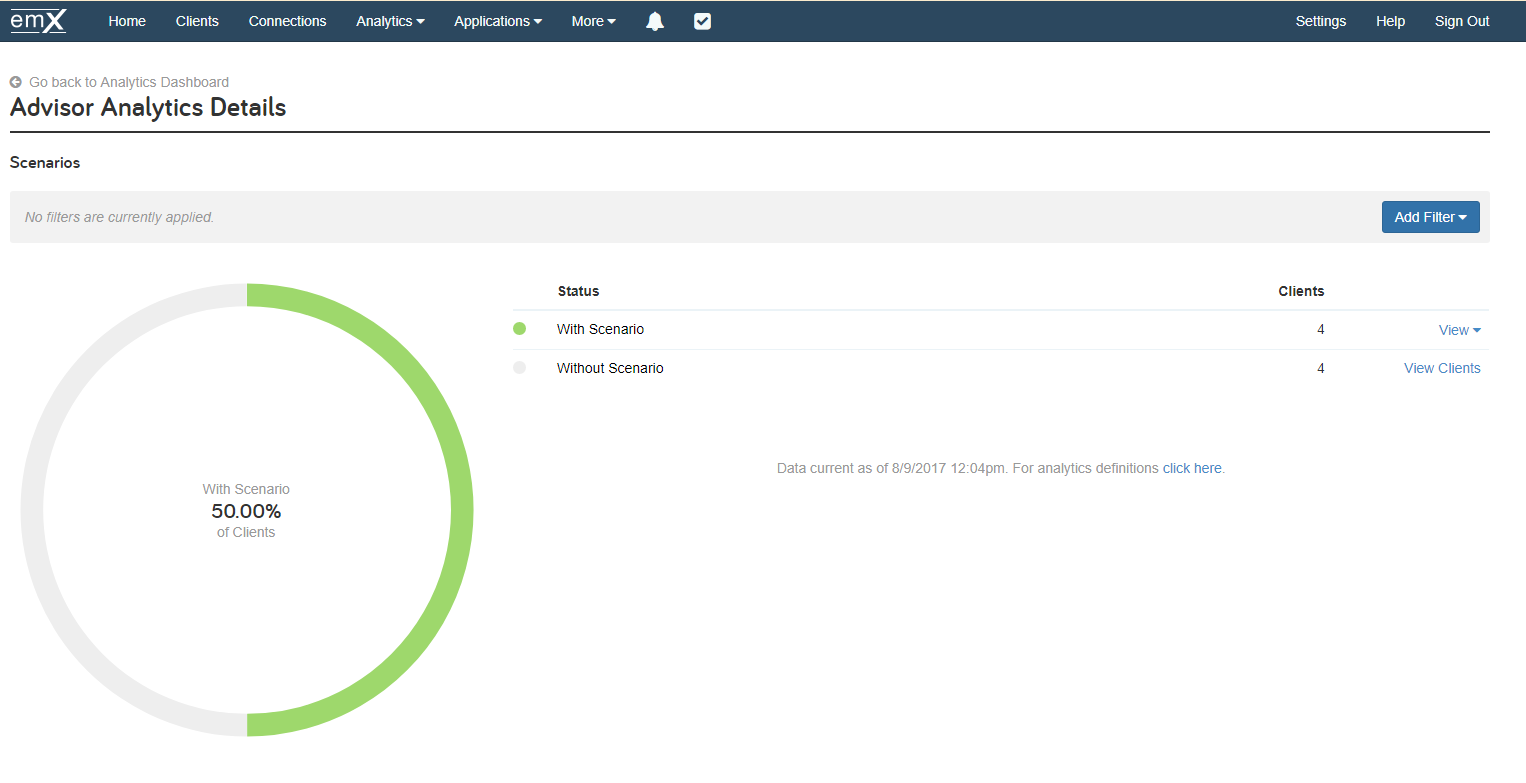
Next in that series, and being released soon, will be the Scenarios chart. This chart, which provides a view into which clients do or do not have scenarios defined in the system, will help improve visibility into advanced planning scenarios across your clients.
 |
 |
With the Scenarios Chart, you have insight into how effectively you or your team are using eMoney’s advanced planning capabilities to meet the needs of clients – enabling you to take action based on your conclusions. See how individual advisors and firms can use the latest chart below.
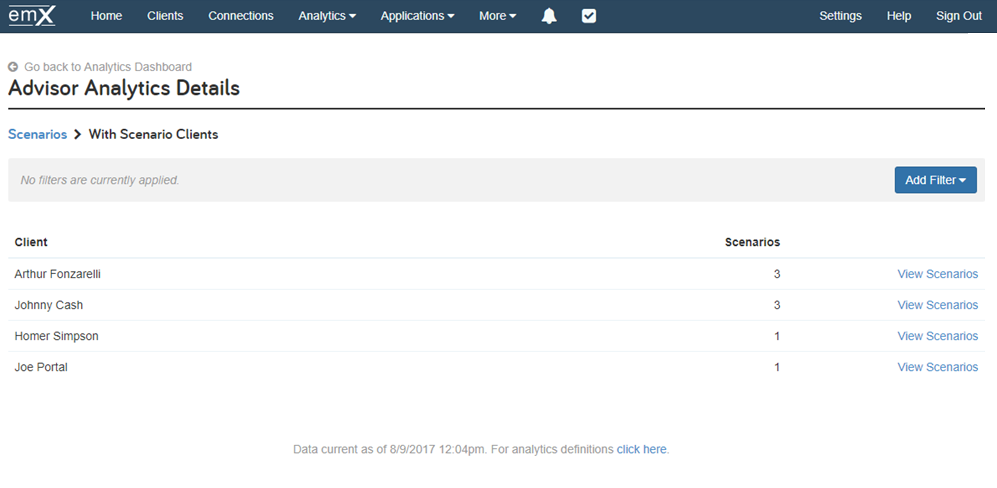
For individual advisors using Advisor Analytics Pro, the Scenarios chart quickly shows which clients have financial planning scenarios created and which do not. With this insight, you can easily determine if a client or group of clients need planning attention. When no scenario exists or when you find a gap in a client’s level of planning, take immediate action by drilling into the scenario and navigating directly to the client’s Plans page from the Analytics Dashboard.
The Scenarios chart can also be used to evaluate a client’s past planning activities with your business. Prior to a meeting, simply bring up the Scenarios chart, drill down into the client, and uncover what, if any, scenarios have been created for their profile.
For managers using Office Analytics, the Scenarios chart offers transparency into how your teams are leveraging eMoney’s advanced planning functionality. Drill into a specific client’s planning scenarios to view which advisor created the advanced plan and determine if your advisors are using all the tools available to them to meet the needs of their clients. You can then leverage these insights during business development meetings to help your advisors capture more share of wallet by better serving their clients.
To add the Scenarios chart to your Analytics Dashboard, click the Add Charts button and then select the Planning section.
Interested in Advanced Analytics? Learn more here.