
for expert insights on the most pressing topics financial professionals are facing today.
Learn MoreIn times of uncertainty, your clients look to you to restore confidence in their financial plans. How do you show them their plan is on track so they stay focused on long-term goals and not short-term volatility?
Monte Carlo simulations can ease your clients’ discomfort by predicting the probability of success for their plans, when faced with a thousand different scenarios.
This post will discuss how Monte Carlo works in eMoney, the inputs you need to be aware of when using it, and some of the most impactful reports you can use to demonstrate Monte Carlo analysis to your clients in each planning tool.
This high-level description of Monte Carlo Analysis by eMoney Advisory Training Specialist and CFP, Brett Tharp explains:
“Monte Carlo in financial planning is calculated through the creation of a correlation matrix. This matrix plots a vast number of market variables on X and Y axes, then assigns a numerical value to the relationship, or correlation, between each market variable. The data on these relationships are used to influence the returns seen when running Monte Carlo simulations. The standard deviation of these results is calculated, giving the overall Monte Carlo output an upside, downside, and median outcome. These values represent the best, worst, and most likely outcomes of a financial plan, respectively, given a large number of different market conditions.”
Monte Carlo in eMoney relies on our proprietary correlation matrix used in coordination with the market indices under your Investment Assumptions. Each market index has a corresponding Rate of Return, Mean Rate (arithmetic), and Standard Deviation that feeds into our Monte Carlo analysis.
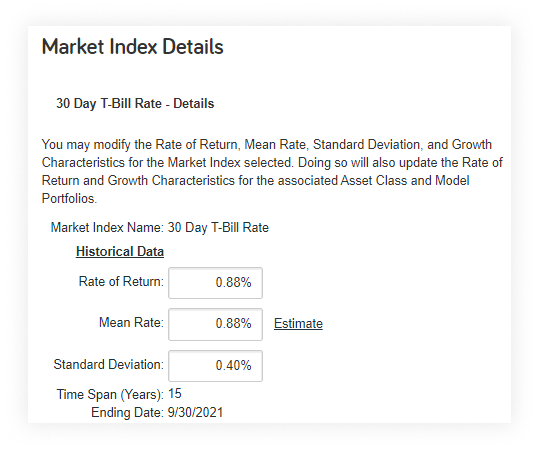
Note: This is why, as a best practice, we discourage the use of custom growth rates for accounts entered into the system. Applying a custom rate removes the asset from the correlation matrix.
The system then runs 1000 trials with randomized growth rates to demonstrate the potential range of results and returns the Probability of Success.
You can also customize your scoring range, name, and colors for the Probability of Success reports within your Monte Carlo settings. Go to Settings on your navigation bar and select Monte Carlo.
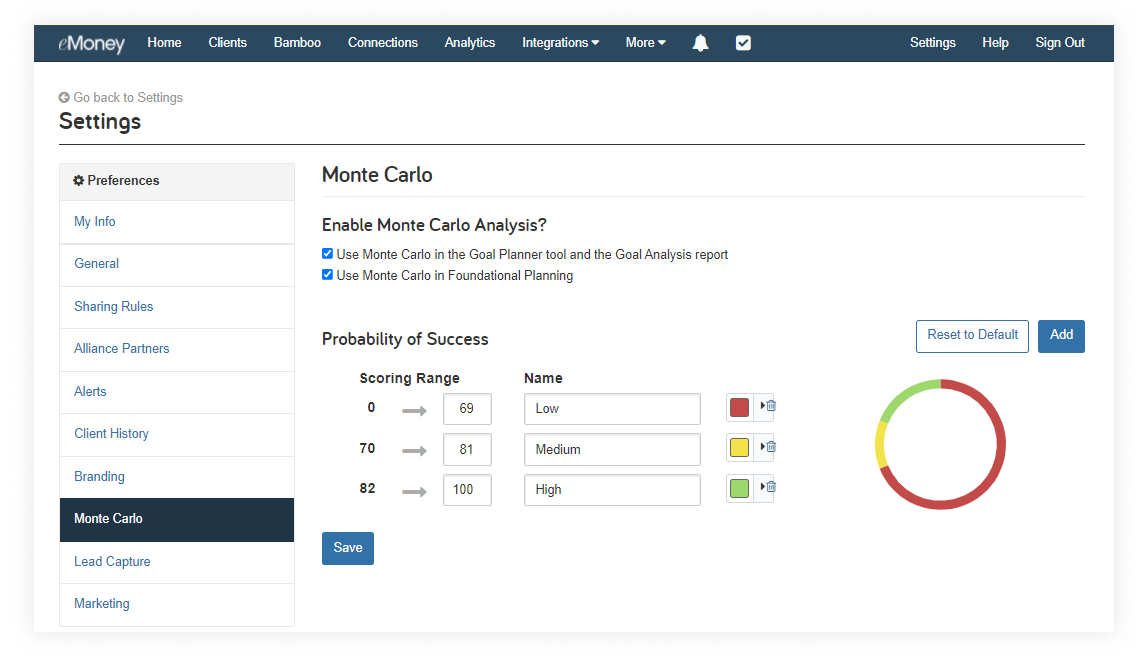
Note: You can even select a custom color value by clicking into the color and inputting a custom color hex value.
So, where in eMoney can you leverage Monte Carlo analysis for your client conversations?
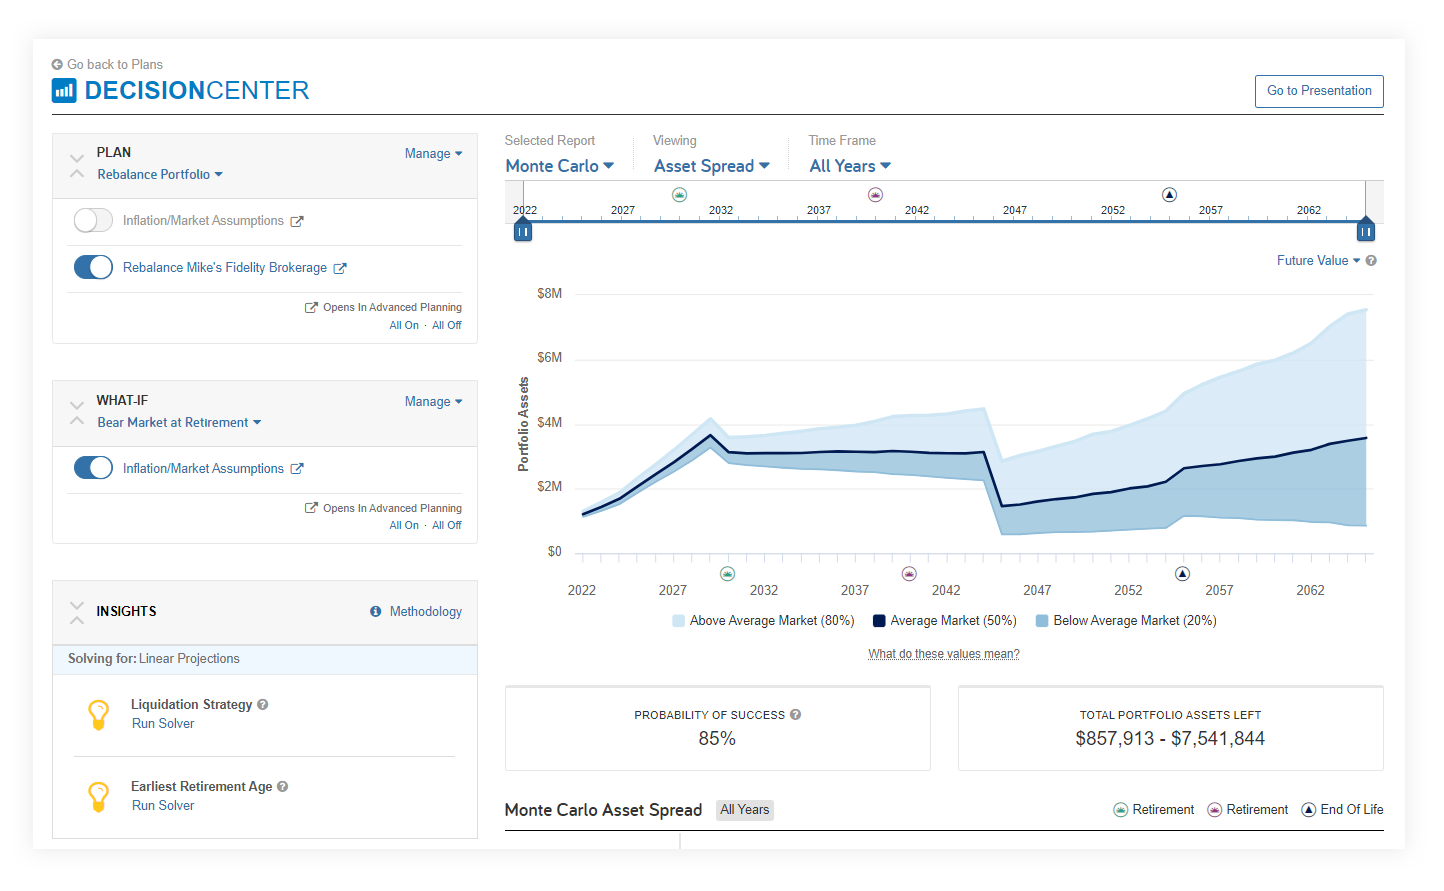
Decision Center is our most powerful interactive planning tool and includes a variety of Monte Carlo reports with multiple views. It also lets you toggle between Plans and Techniques—demonstrating the impact of changes on their Probability of Success and portfolio assets over time.
This flexibility makes it powerful for all client types, but especially with clients who already have substantial assets and want to understand how unexpected events, market conditions, and lifestyle goals could impact their plans.
Use the Asset Spread report for clients concerned about leaving a legacy. It provides a simplified view of the Above Average (80%), Average (50%), and Below Average (20%) Market simulations and the possible range of Total Portfolio Assets Left between the upper and lower bounds.
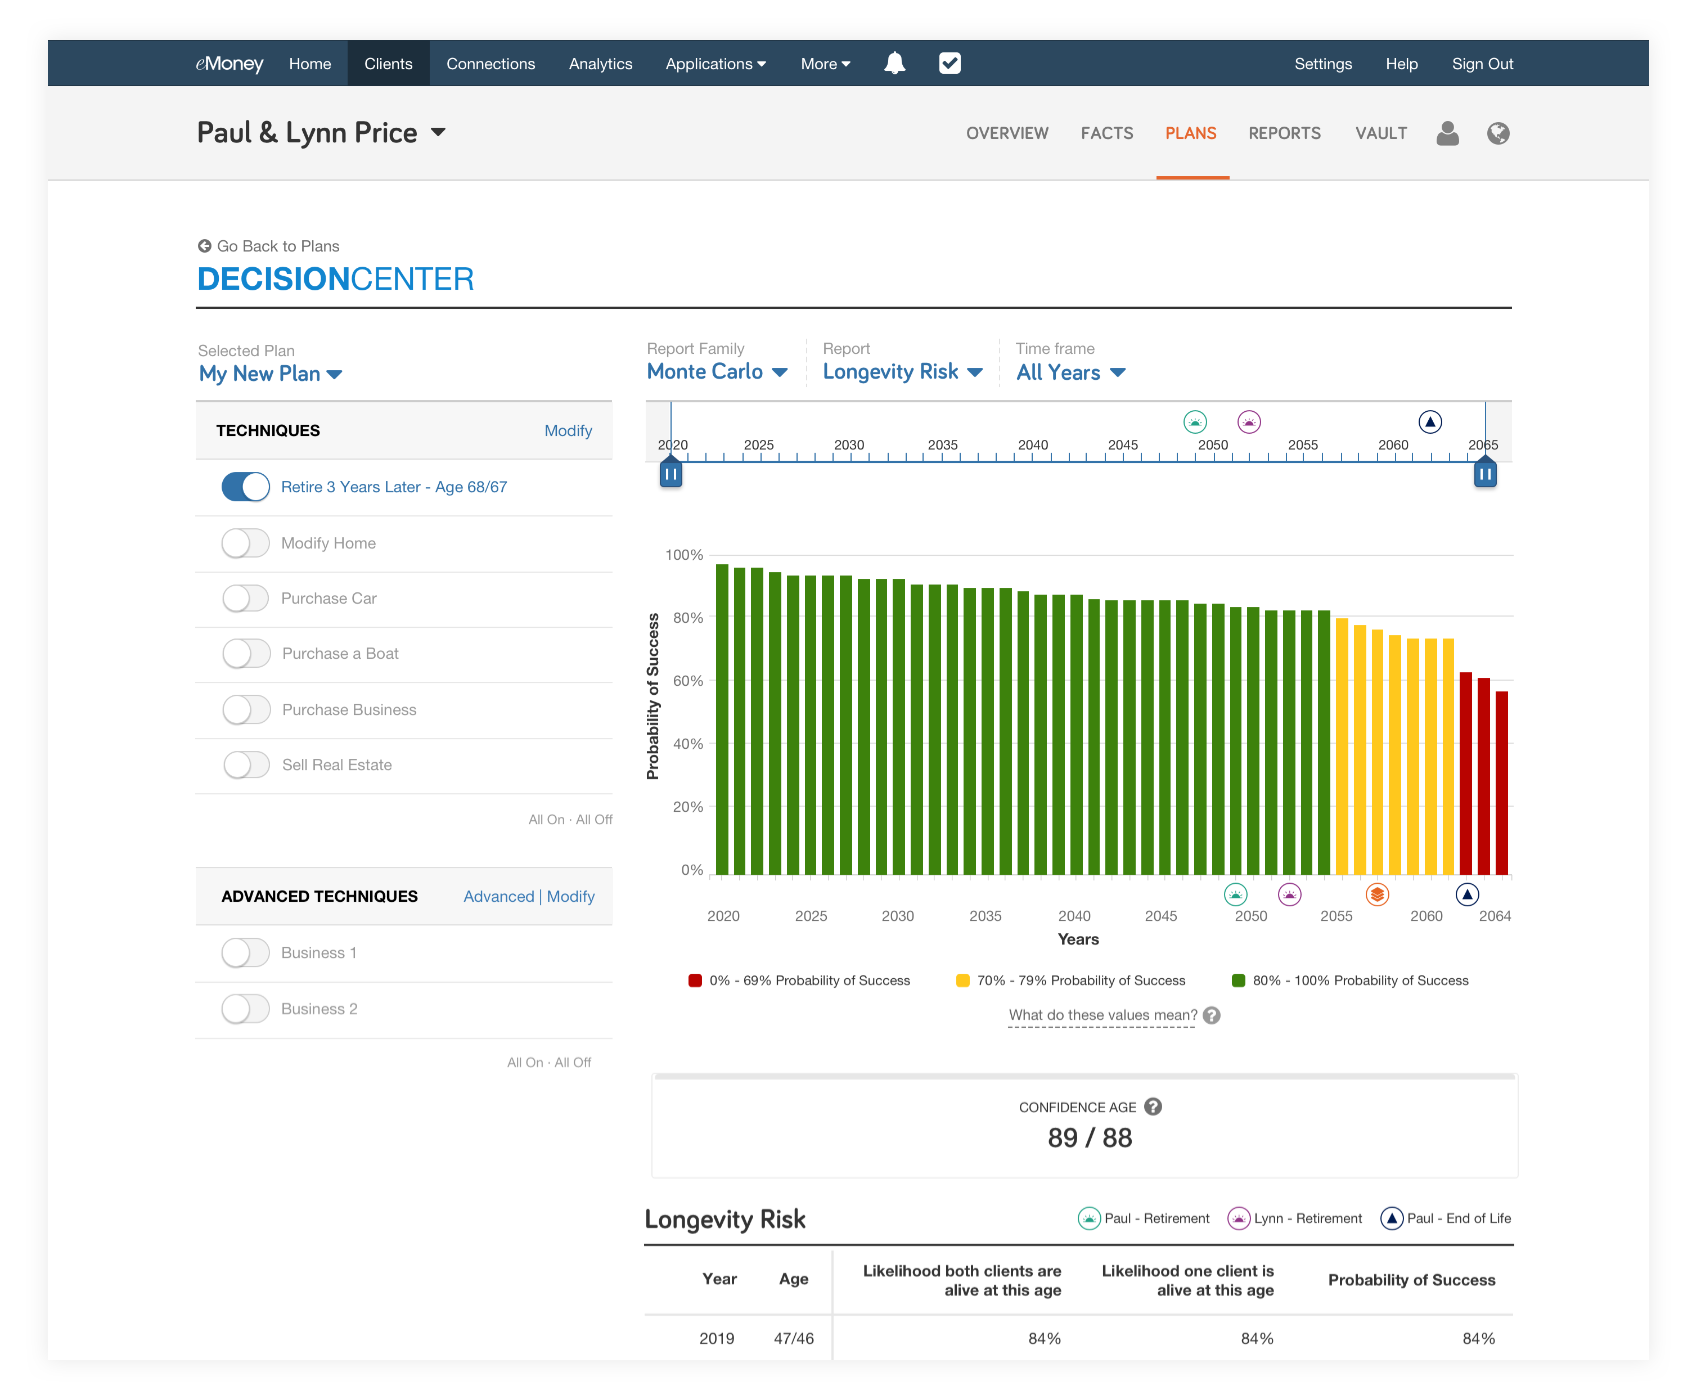
For the clients asking the question, “Will I outlive my assets?” try our Longevity Risk Analysis. This report uses our proprietary planning metric, Confidence Age, which identifies the age at which the client’s Monte Carlo success rate drops below the confidence threshold you set while showing how that probability changes over time.
Check out our interactive training guide for Monte Carlo in Decision Center to learn more about all available reports.
Goal Planner focuses on cash flow-based goal planning and is an ideal tool for younger clients or those with multiple expense goals.
It allows you to illustrate up to four separate financial scenarios side by side. Each Plan displays its Probability of Success, and you can click into individual goals to edit the assumptions and see the immediate impact the change has on the outcome and funding of the goal.
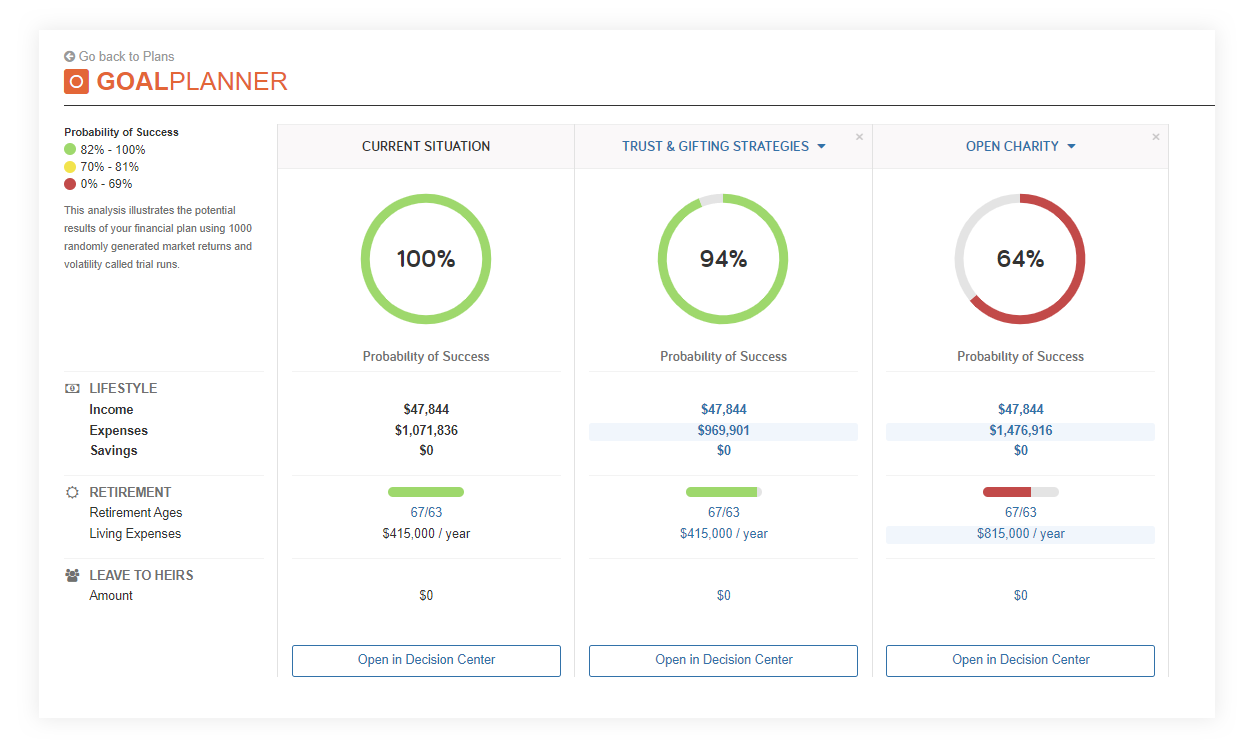
One of Goal Planner’s unique features is that you can view the Worst Case and Likely Case scenarios when you click on the goal. In these views, eMoney analyzes all possible funding within the bottom 80% of all trials while leaving the top 20% out.
You can use this with goal-focused clients as it explores the “worst” and “likely” cases within those 800 simulations in-depth, demonstrating what funding levels they can expect.
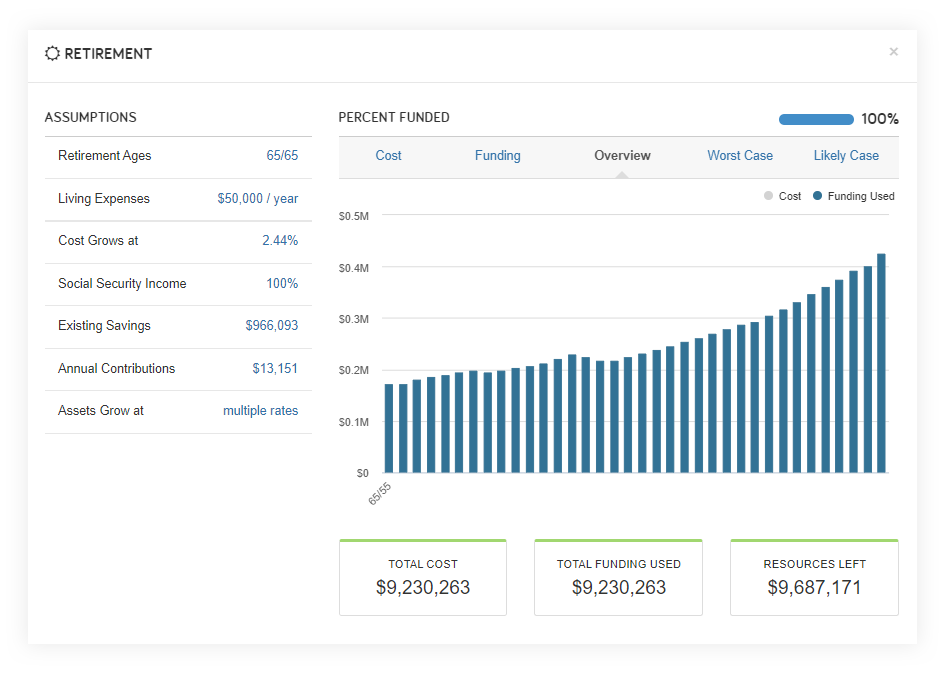
Check out our interactive training guide for Monte Carlo in Goal Planner to learn more about all available reports.
Each Monte Carlo Analysis report found in a client’s Reports center provides a unique view into their Monte Carlo. Use these reports in your deliverables to give clients confidence in their plan.
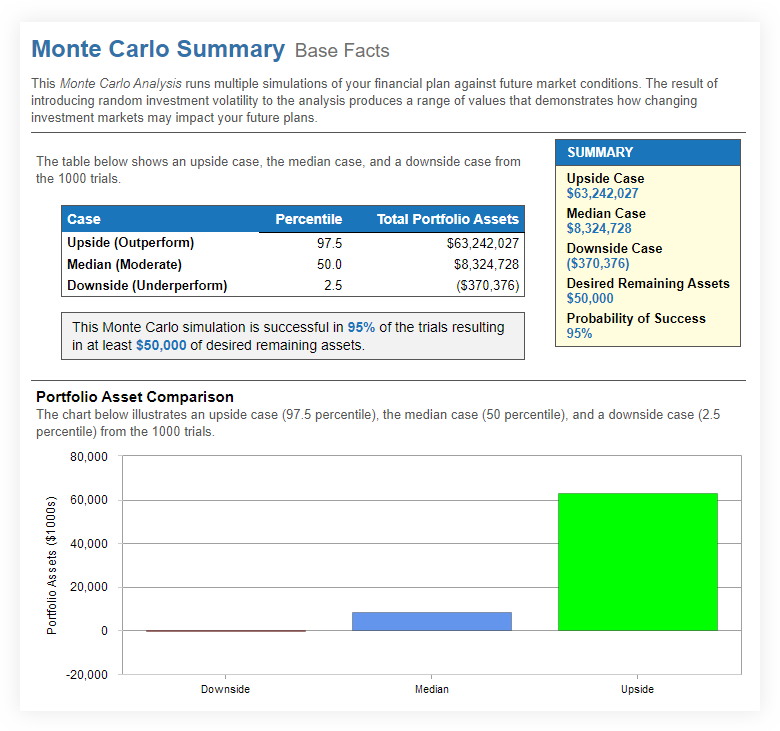
The Monte Carlo Summary report includes various details about the upside, median, and downside cases. We recommend highlighting the block which shows the percentage of successful simulations resulting in their desired remainder amount when presenting this report.
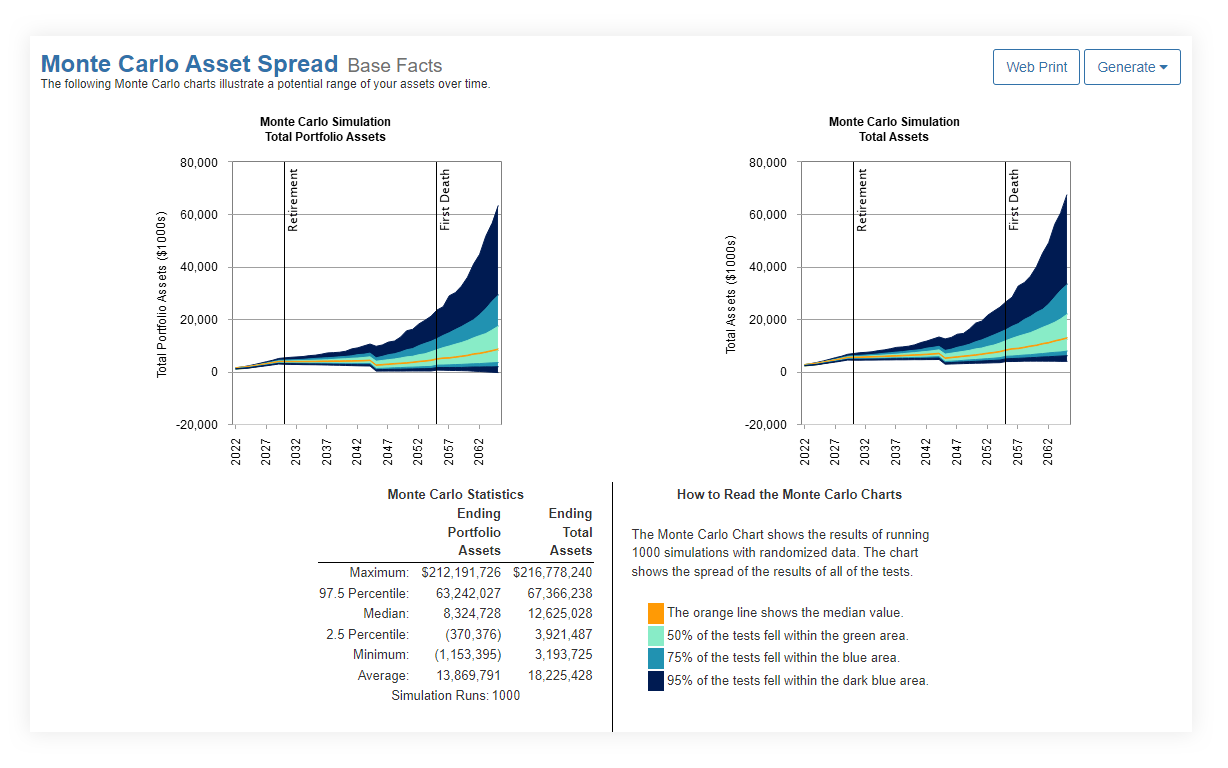
Using the Asset Spread report, you can more clearly demonstrate to clients the range of potential assets. While the orange line represents the median result, you can also discuss the green and blue areas that represent the majority of results and how a greater spread in these areas represents a more variable result with potentially greater risk.
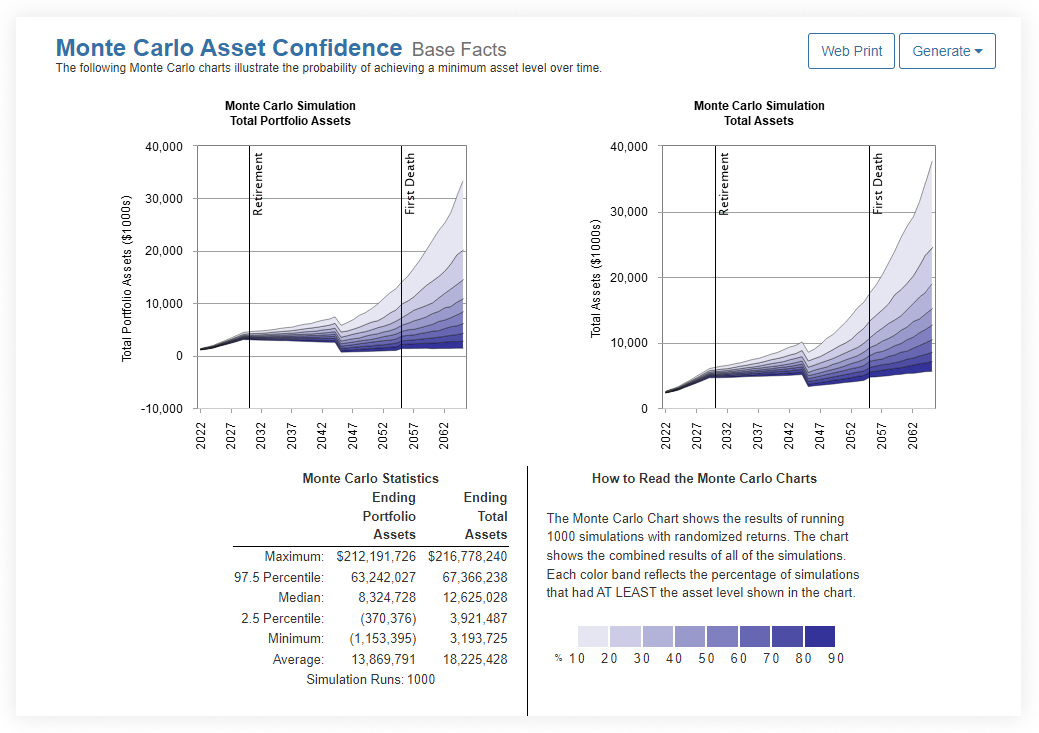
You can also use Asset Confidence to show clients the likelihood of falling within a given range of ending total assets. Color bands clearly demonstrate the percentage of simulations with at least the asset levels shown in the chart.
Check out our interactive training guide for Monte Carlo presentations to learn more about all available reports.