
for expert insights on the most pressing topics financial professionals are facing today.
Learn MoreAdvanced Analytics helps to truly differentiate your business by offering data-driven insights into the wealth of client and investment data that passes through your eMoney Platform every day. But beyond the many insights available in Advanced Analytics today, we’re also committed to developing new charts based on your feedback and the evolving challenges of the industry.
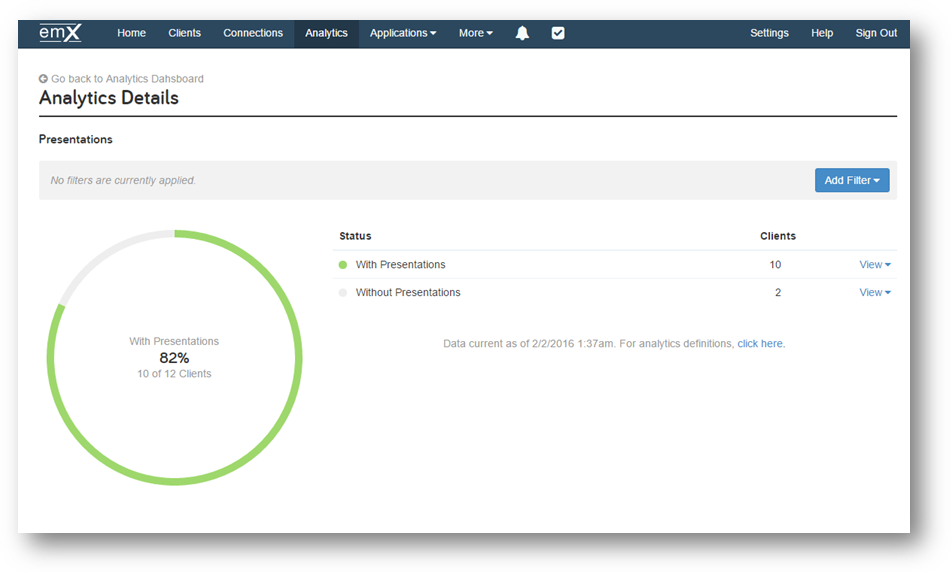
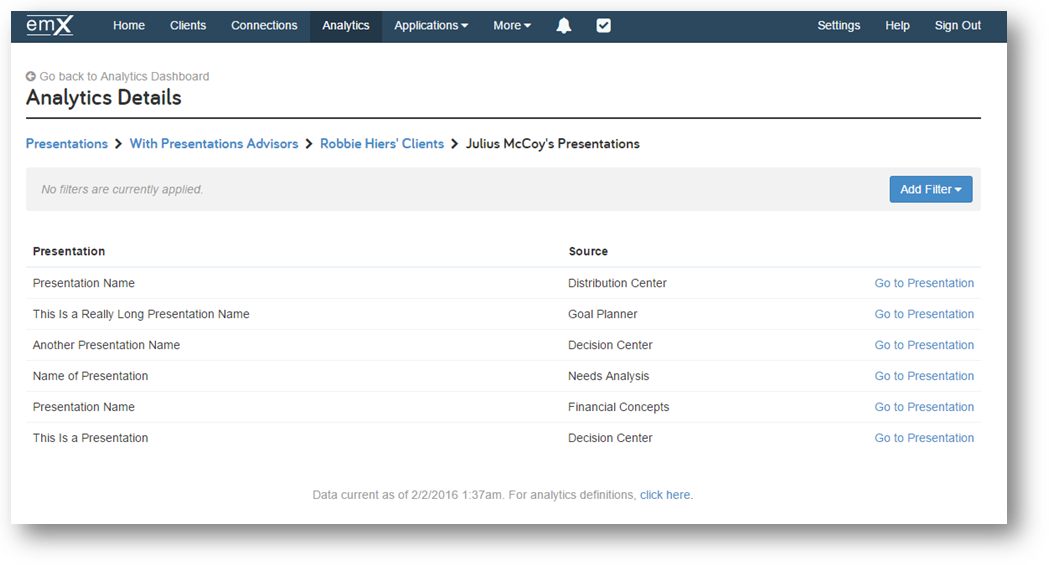
Coming soon, we’re adding the first planning-focused chart designed to help improve your visibility into presentations across clients. Known as Presentations, this chart provides insights into how well you or your advisors use eMoney’s presentations to meet the needs of clients and allows you to take action based on your conclusions.
 |
 |
The Presentations chart provides a view into the number of presentations that have been released and is available at both the individual and the firm-levels.
To add the Presentations chart to your Analytics Dashboard, click the Add Charts button.
Stay tuned for continued Advanced Analytics enhancements.
Interested in Advanced Analytics? Learn more here.