for expert insights on the most pressing topics financial professionals are facing today.
Learn MoreeMoney’s standard configuration uses a rolling 25-year historical period for (most indices) to calculate the rate of return for equity indices and releases new historical data quarterly (typically within six to eight weeks after the quarter ends).
These capital market assumptions power the cash flow simulation at the core of all of your clients’ financial plans. That’s why it’s important to keep your market index data updated and understand each of the building blocks that go into constructing eMoney’s Investment Assumptions.
Let’s take a look at eMoney’s Investment Assumptions starting with the Model Portfolios tab.
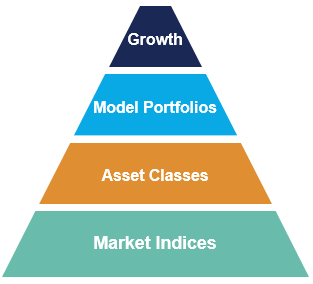
These are the foundation of the eMoney Cash Flow Simulation. You need market indices to build your asset classes, you need asset classes to create your model portfolios, and you need model portfolios to accurately define the growth rate of well—everything.
The Market Indices tab allows you to modify the rate of return, standard deviation, or growth characteristics for a system-defined index, create a custom index, and update the market index data when new quarterly data is published.
Every market index is composed of historical data and growth character. These factors determine how the index interacts within the eMoney Cash Flow Simulation.
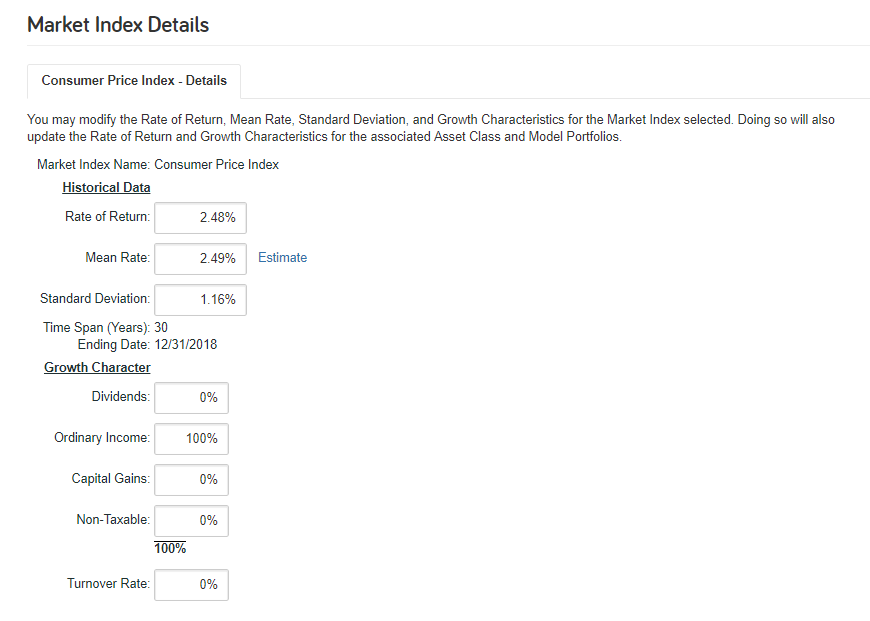
Historical data has three core components that control the index’s performance and two that describe the span of time upon which it is based:
Pro tip: While you can add your own custom indices, they will not be correlated with other index data in Monte Carlo simulations and Efficient Frontier analysis. However, modifying the rate of return, mean rate, and standard deviation for a system-defined market index will maintain correlation with other index data.
Growth character is composed of five characteristics, largely identifying how gross growth is treated for tax purposes: dividends, ordinary income, capital gains, and non-taxable. Additionally, the turnover rate describes the annual turnover of securities within an index.
Pro tip: Growth character is especially important because it determines the realization model for accounts using model portfolios that include asset classes made up of the market indices. Turnover specifically has two functions. It simulates the percentage of the account being sold and reinvested each year, which generates capital gains and revises the basis of the account. Meanwhile, it also applies the capital gains portion of the annual growth generating taxable, short-term capital gains.
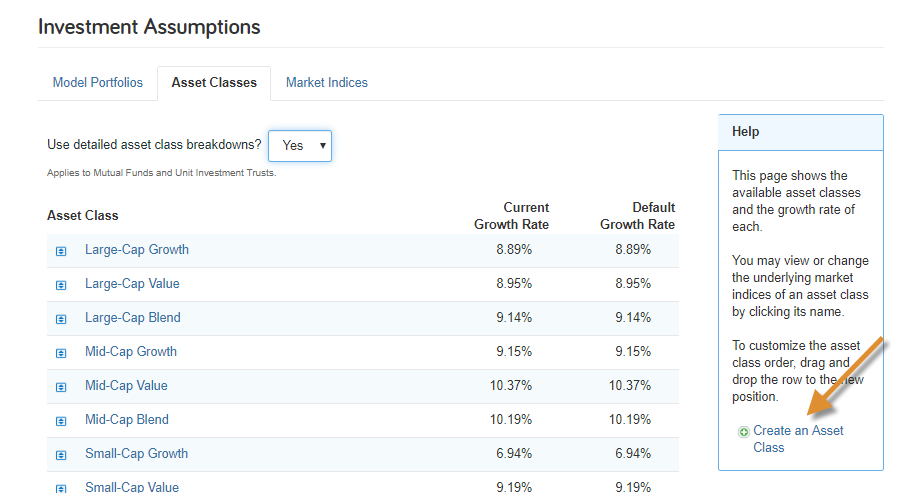
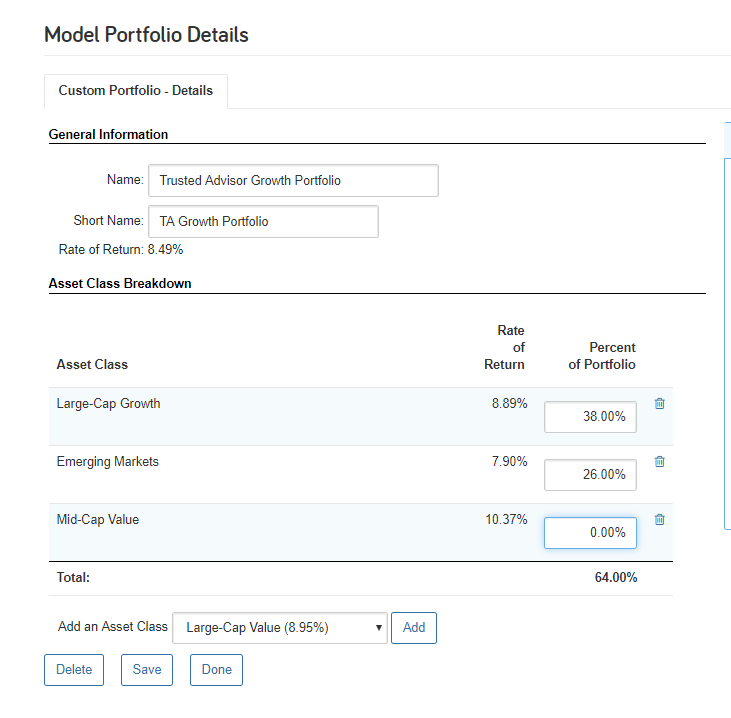
Asset classes comprise one or more market indices and are used to represent groupings of investments with similar growth characteristics. Here you can create new custom asset classes, edit existing ones by adding or removing market indices, or re-order the list by dragging and dropping.
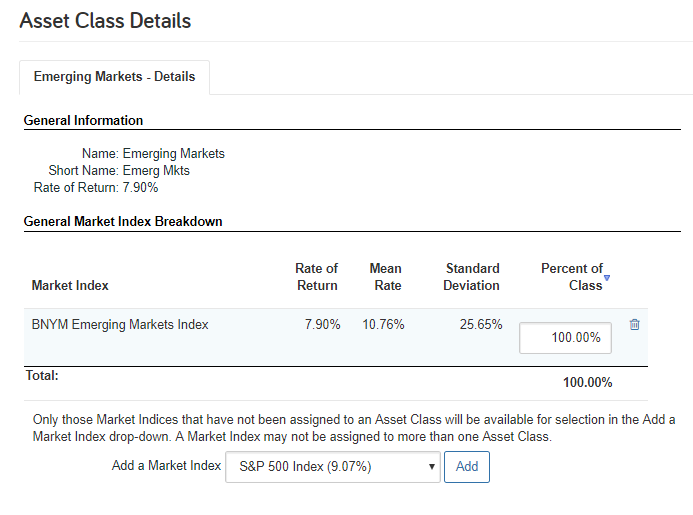
Editing Asset Classes is as simple as adding additional Market Indices and defining the percent of class that each index defines.
Note: Each Market Index can be only be used ONCE when tying it to an Asset Class.
Model Portfolios allows you to adjust inflation, modify existing portfolios, add custom ones, or remove them entirely.
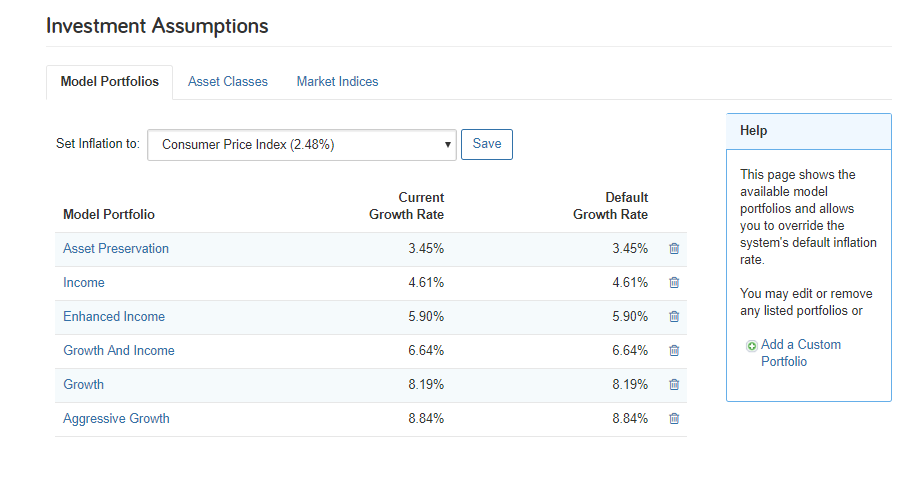
Pro tip: Inflation is typically set to the Consumer Price Index (CPI) by default. The CPI is shielded from bear market what-if scenarios to avoid fluctuations in living expenses, but is not shielded from variance and volatility when running Monte Carlo. Inflation will also be tied to the growth of the underlying tax brackets, exemptions, exclusions, and contribution limits.
While our default Model Portfolios cover a wide range of planning options, we recommend customizing them to your business to streamline the process of entering client data and onboarding. You can even create your own Custom Portfolios to utilize your firm’s specific model portfolios and recommendations, simply:
By customizing your Market Indices, Asset Classes, and Model Portfolios to your business, you can be sure that the foundation of your client’s cash-flow simulation and their experience is unique to your business.
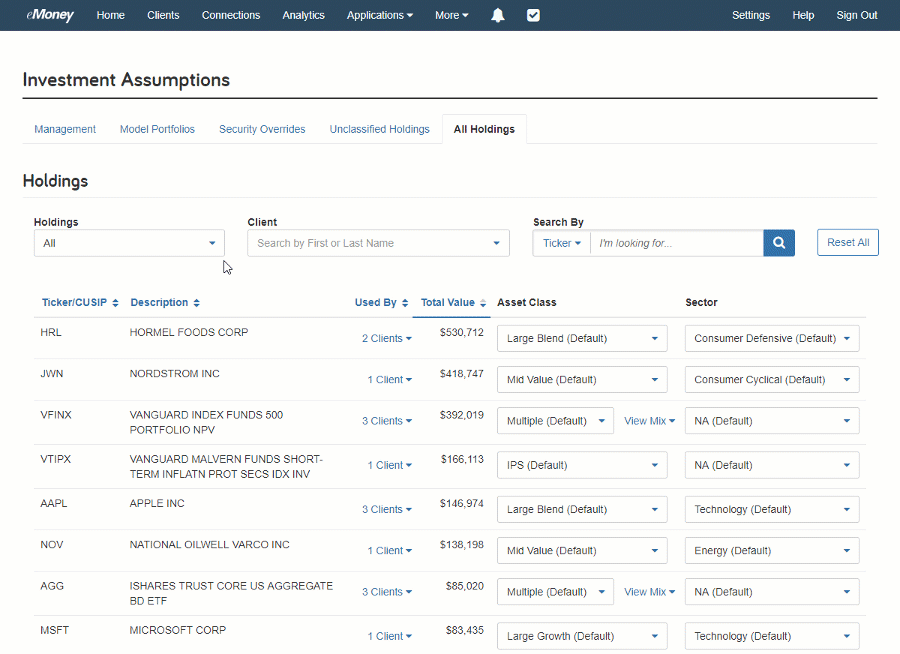
This view, available for advisors and delegated support users, allows you to easily identify all your clients with holdings under a specific Ticker or CUSIP and, if necessary, update the holding’s underlying asset class or sector. It makes the process of parsing your client’s holdings data simple by giving you the ability to:
This means that you can instantly see how many clients have holdings that include a security and who they are. You can even select to view All Unclassified Holdings at once to quickly identify and correct missing Asset Class and Sector data.
Have more questions about your Investment Assumptions? Check out the resources available in The Knowledge Base under Help within your eMoney application.