for expert insights on the most pressing topics financial professionals are facing today.
Learn MoreIn order to project a client’s financial condition into the future, advisors must use assumptions to account for the unknown variables that can have a significant impact on the simulation. Market performance is just one example.
Different sayings ring true when it comes to forming assumptions. If you polled 100 advisors and asked each to give their outlook on what the markets will do in 2818the next 5, 10, 15, even 30 years, you would receive 100 different responses. Because of this, the capital market investment assumptions in eMoney can be edited to reflect a specific advisor’s investment outlook.
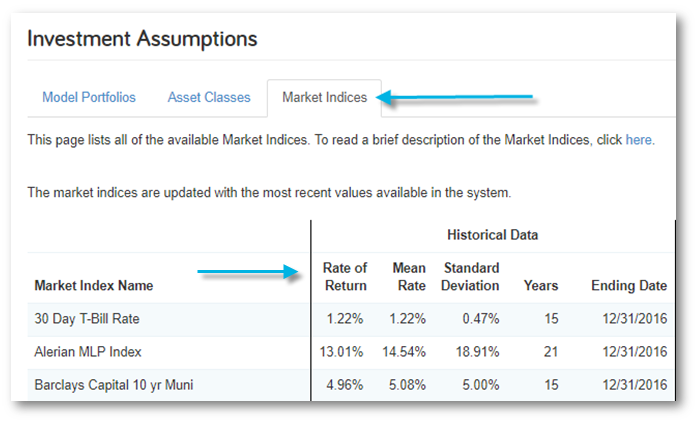
There are three primary layers of investment assumptions in eMoney: Market Indices, Asset Classes, and Model Portfolios.
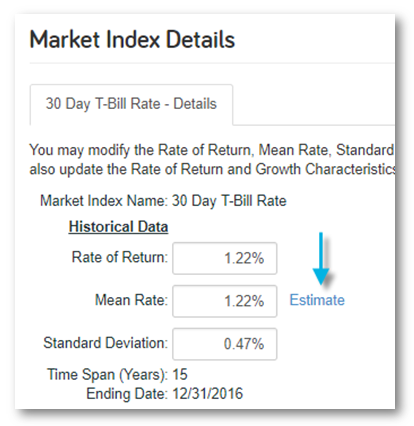
Market Indices are the building blocks of your Investment Assumptions, in the real world a market index tracks a specific section of the market and provides historical performance data. The default indices in eMoney can be edited so that a precise rate of return, mean rate, and/or standard deviation is utilized.

The geometric mean is used for Cash Flow projections, while the arithmetic mean is used for the Monte Carlo simulation. As new historical data becomes available, the indices are updated. Despite the ability to manually change a mean rate, it is a best practice to use the “estimate” link to derive the appropriate mean based on the desired rate of return and standard deviation.

The formula to approximate the mean is (rate of return) + (standard deviation)2/2.
Quarterly updates to the historical market index data include the latest historical figures from the most recent quarter’s performance data. Using this estimate, you get the equivalent mean rate based on the rate of return and standard deviation.
This is a best practice to ensure that equivalent statistics values are being used in both Cash Flow and Monte Carlo.
When using custom Mean Rate assumptions be aware that situations, where the ending Total Portfolio Assets in Cash Flow is significantly different from the median case in Monte Carlo, can occur. While these values will never be exactly the same (even when using the Estimate Mean link), they should be relatively close to each other.
For more information on Capital Market Assumptions check out this Planning Guide available in The Knowledge Base.