for expert insights on the most pressing topics financial professionals are facing today.
Learn MoreWe’ve made some enhancements to your Analytics dashboard to give you a more efficient look at your clients’ financial health and help proactively identify opportunities. Check out our improvements below.
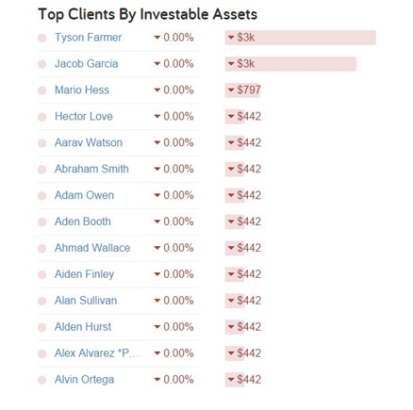
We replaced the Top Movers section with Top Clients by Investable Assets. Doing so narrows the focus of this section to your top 14 clients, making the data easier to read and interpret.
Displayed in the Top Client by Investable Assets section is the client’s name, the percent change across each of their holdings, as well as the net change across each of their holdings. Both the percent change and net change have an arrow icon, indicating whether the change is positive or negative.
Clicking into a client’s name allows you to view their individual holdings in more detail. Here, you can see each individual holdings value, percent change, and net change as well as how many accounts it currently inhabits.

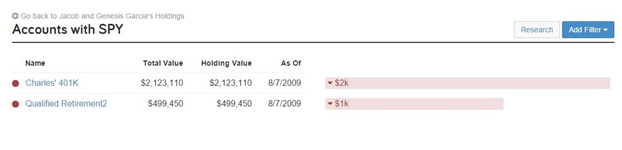
By clicking an individual ticker symbol, you are able to see every account that houses that particular holding. Here, the value shown is the net change for the holding in each account. You can also click “Research” to view market research for the current holding. Additionally, clicking on an account takes you to that account in the Advanced Facts section.
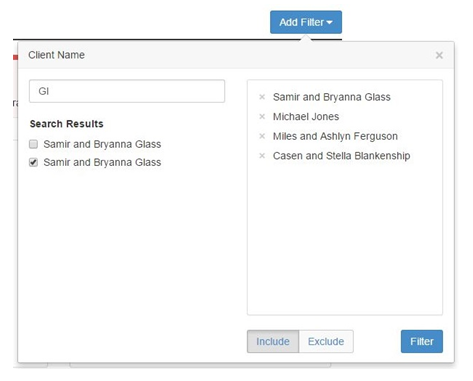
To cut down on time spent searching for specific clients, we updated several filters.
In the Client and Institution filters, we added a search bar to help manage the large number of options available. As a default, the client filter displays your top ten clients and the institution filter displays your top ten institutions.
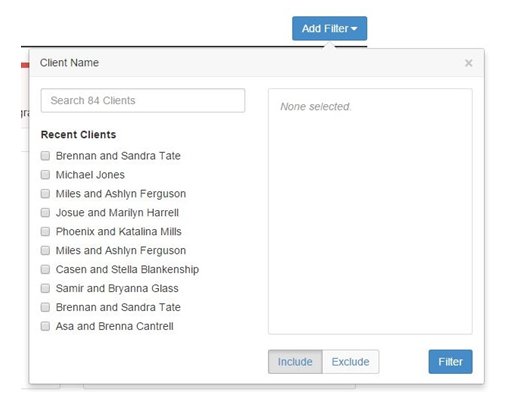
Selected options will be shown on the right hand side, while the search box can be used to quickly find an option.
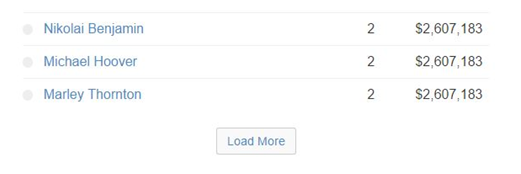
To help make navigating the results of each filter more manageable, we limited all filter results to 100 and added a “Load More” button that will load 100 more results at a time.