
Learn more about the latest eMoney updates, including the new Reports available within Decision Center, our ongoing Commitment to Connections, the updates done to the SECURE ACT 2.0 of 2022, and more.
For more information on these updates, sign up for the latest product update webinar.
Released March 28
As part of our commitment to making Decision Center more efficient, engaging, and effective for your planning needs, two impactful updates are now available:
You need to view, filter, and ensure the accuracy of your client’s holdings quickly and without interruptions to your workflow or client conversations. This is why we’re bringing our top investment reports into Decision Center this year—starting with the Holdings Detail report!
The Holdings Detail report provides reliable, non-projection holdings information, free from the influence of other techniques and solvers, allowing you to make informed decisions with confidence.
Focusing on enhancing the efficiency, effectiveness, and engagement of the planning process, you will start to see a range of new reports being added to Decision Center throughout 2023. These reports, including Holdings Gain/Loss, Asset Allocation, Account Summary, and more, will further elevate the planning capabilities of Decision Center and empower your clients to achieve their financial goals with ease.
How Can I View the Report Within Decision Center?
The Holding Detail report will display under the Viewing category by selecting Investments under the Selected Report category as shown below.
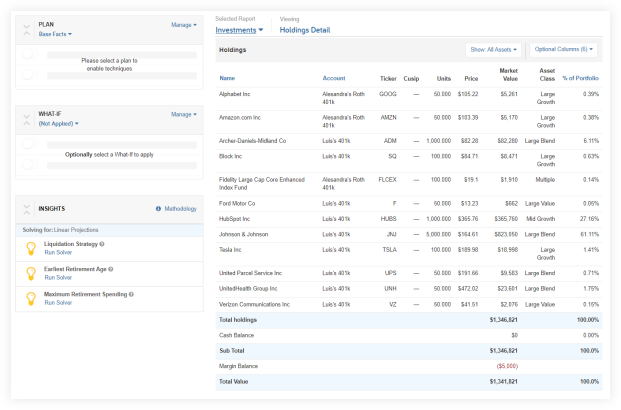
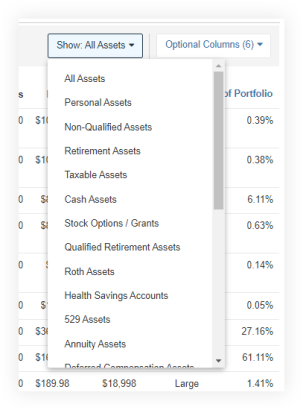
Show: All Assets can be filtered for available assets for that client.
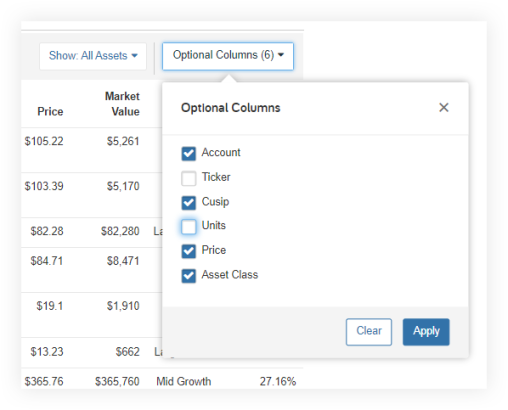
Optional Columns can also be filtered to show only the desired columns. Click Apply when the desired columns have been checked. Click Clear to uncheck all boxes.
Please note: Filtering choices and sorting will remain in place while you are under the Plans tab. Leaving Planning to go to the Client Overview, for example, will reset filters. This report will also not be impacted by selected Plans or What-Ifs which is intended and reflects the existing report in Presentations.
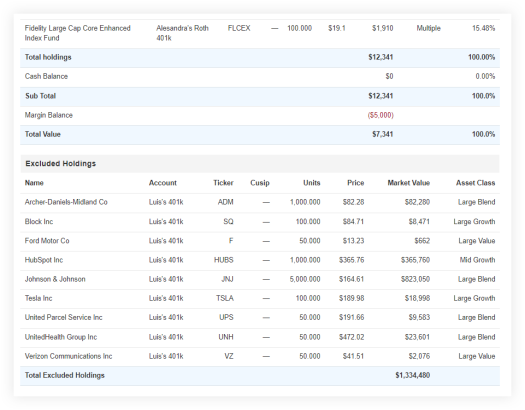
If there are accounts that have been identified to exclude from holdings within the Advanced Fact Finder, they will be listed below the Holdings Detail report under Excluded Holdings.
Provide your client with a fuller picture of their financial journey by combining historical and forward-looking data into a single, easy-to-use report.
How Does It Work?
The Progress Report features a unique chart that combines the historical value of a client’s total portfolio assets with Monte Carlo Asset Spread views of market performance, enabling you to track progress towards your client’s goals and quantify the value of their actions. This report is the first step towards more comprehensive goal tracking and highlights our commitment to delivering you cutting-edge tools within Decision Center. Present the Progress report to clients for a truly collaborative and data-driven approach to financial planning.
How Can I View the Report within Decision Center?
Under the Selected Report category, you will choose Progress.

The left side of the chart shows the historical view of Total Portfolio Asset value at the end of each month.
When hovering over a point on the chart, a card will display the year, age of client and spouse and the Total Portfolio Assets value for that month.
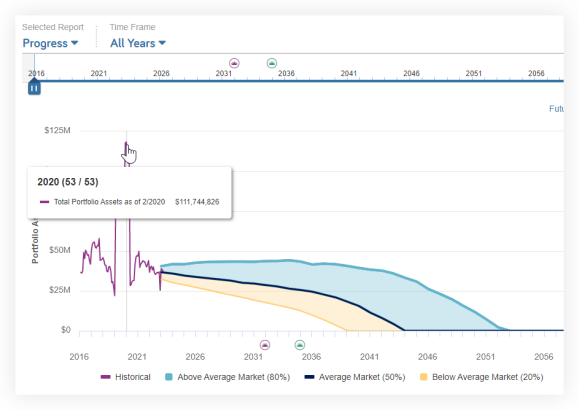
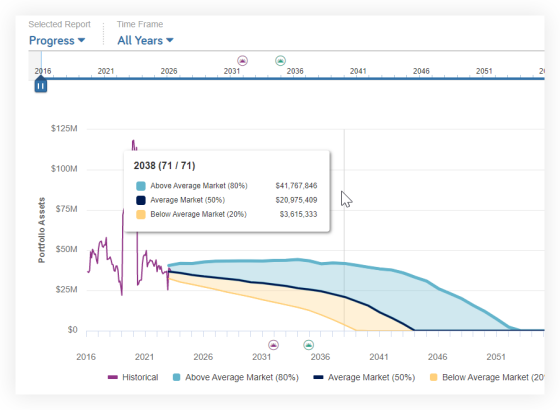
The right side shows the range of results from the Monte Carlo asset spread analysis.
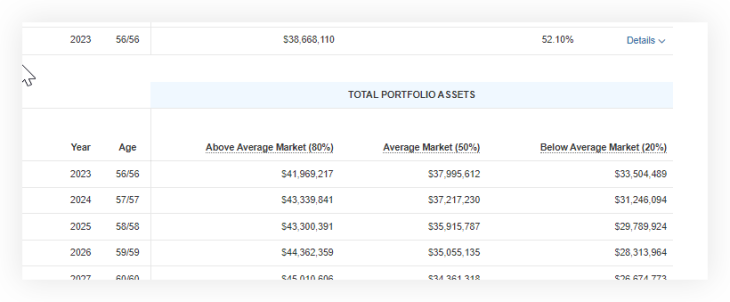
When hovering over the chart, a summary card shows the year, age of client and spouse, and the Total Portfolio Asset values for Above Average Market, Average Market, and Below Average Market scenarios.
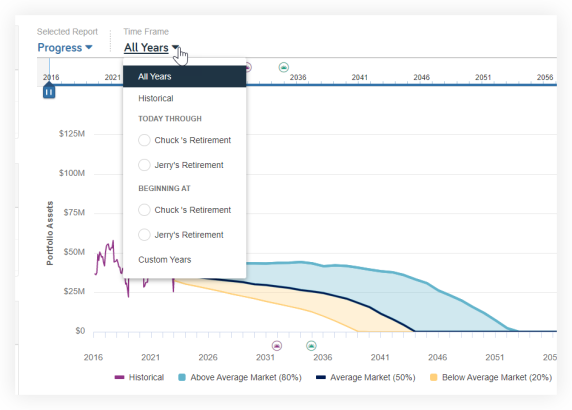
Under Time Frame, the default is All Years. From the drop-down, you can select from several additional predefined views or define a custom date range.
The slider feature allows you to alter the range of years shown on the chart. When this is used, the Time Frame will automatically update to indicate Custom Years. The chart will adjust to show only the years selected. The metric cards and data table are not affected by the use of the slider.
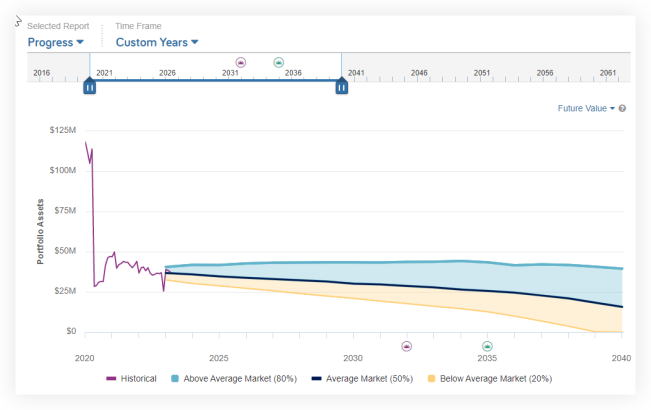
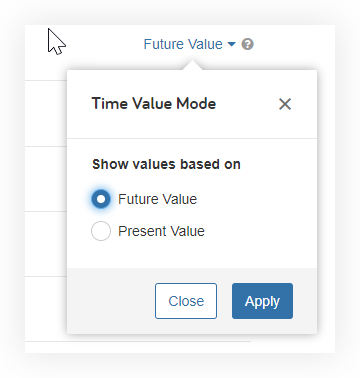
Time Value Mode is defaulted to Future Value but can be changed to Present Value.
The four metric cards for the Progress report are displayed below the chart. The two cards on the left side are associated with the historical values of Total Portfolio Assets. The two cards on the right are associated with the results of the simulation for the Plan and What-if scenarios selected.

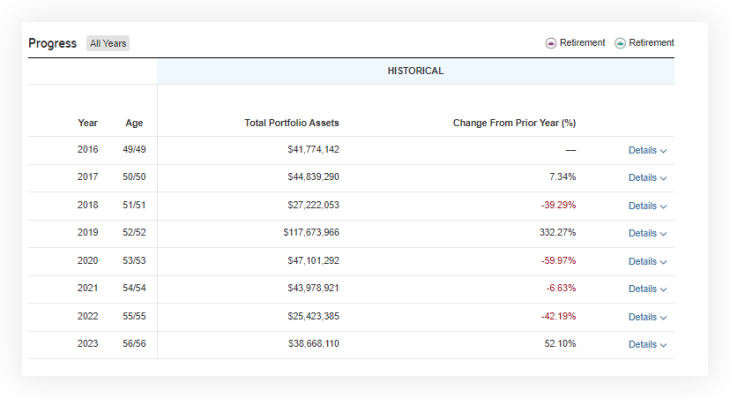
The Historical table below the metrics cards shows the Year, client and spouse ages, Total Portfolio Asset value as of year-end, and the percentage change in total portfolio assets from the previous year.
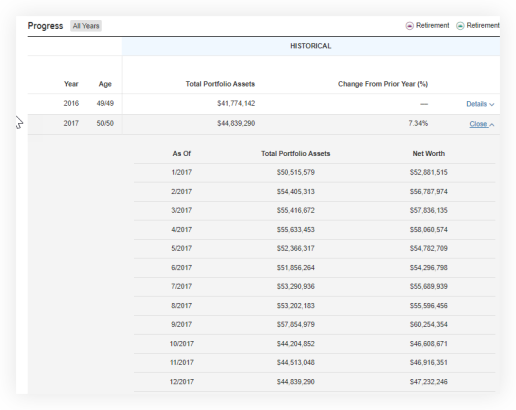
The ability to expand the Details within the table is available to see the monthly value in each year by selecting Details to the right of each column. The Details view also provides the client’s net worth at the end of each month.
The Total Portfolio Asset summary section of the table shows the results of the Monte Carlo Asset Spread for each year included in the analysis.
The Progress chart is just the beginning of an exciting journey toward a more comprehensive financial planning experience. In the future, this report will provide even more detail and insights on recommended actions taken, giving your clients a better understanding of their financial journey and creating new ways for you to navigate conversations about recommended actions, such as refinancing a mortgage or increasing a 401(k) contribution and view past probabilities of success. Keep an eye out for continued development on the Progress chart coming to the Decision Center this year!
Released March 2023
Simplify your planning process and make more informed financial decisions with data aggregation. Connections play a crucial role in the planning experience and are one of the most frequently requested and utilized features.
Before learning about our recent progress with connections, learn more about data aggregation…
Why Is Data Aggregation Important?
Data aggregation is used to consolidate all your clients’ accounts into one view on their Client Site–such as their checking accounts, 401(k), and investment account balances–so your clients can easily monitor their finances and you can create an accurate financial plan based on real-time data.
The Shift to API Connections:
An API, or Application Program Interface, allows two systems to interact and connect with each other to create a streamlined flow of data. APIs offer a secure way to collect and copy data because they do not require access to login credentials, which means no transactions can be made. Think of APIs as allowing “view only” access to account data.
Q1 Connections Updates:
We enhanced the connections experience for you and your clients by adding the following connections:
2022 Highlight: In 2022, incredible progress was made in this area: over 900 new connections were added, including APIs for Transamerica, Allianz, and KeyBank. We look forward to continuing to provide you with the best planning experience possible. To learn more about the different types of connections we offer please check out the Help menu resources Your Guide to Data Aggregation, and What You Need to Know About API Based Connections.
Updated March 9
Available as part of our ongoing alignment with the SECURE Act 2.0 of 2022, use the new IRA Inheritance, so if a spouse inherits an IRA, they can elect to adopt the deceased spouse’s age for RMD purposes when it is beneficial to do so.
Follow along and learn what has been updated, and what updates are coming using the blog post below:
Released February 28
⚐ REQUESTED FEATURE
This highly requested update adds the Transferable on Death (TOD) option to cash and taxable accounts. With Transferable on Death enabled, you can assign beneficiaries and the account will automatically transfer on death, avoiding probate.
How Does It Work?
Use the Transfer on Death field to activate the Beneficiary field to control who receives the account upon the account owner’s death.
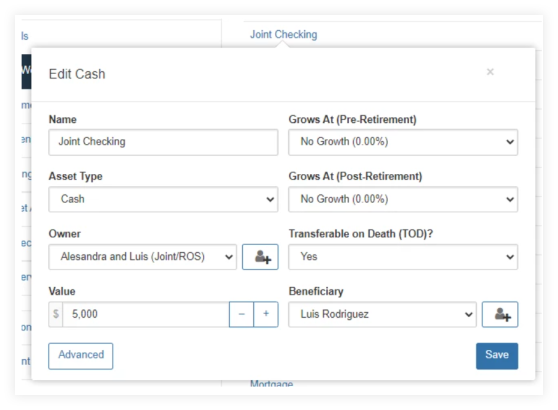
When the Transfer on Death is set to No, the Primary Beneficiary field will be hidden or gray and can’t be edited.

When set to Yes, the Primary Beneficiary field drop-down menu will become available, and can be filled in with anyone listed under Family Information within the Facts.

Please note: When TOD is switched to Yes and a beneficiary is filled in, then the Wills will no longer be relevant for that asset and probate will be avoided.
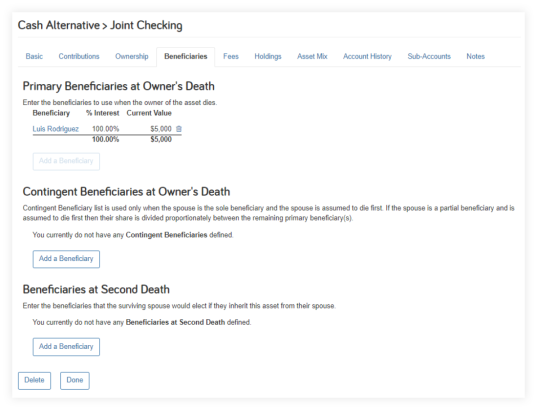
Once a beneficiary has been selected and the changes have been saved, the Beneficiaries tab is now enabled. Use this tab for more complicated Beneficiary situations such as multiple but even beneficiaries. If the TOD is set to No then you will not have access to the Beneficiaries tab.
Can I View These Changes Within Reports?
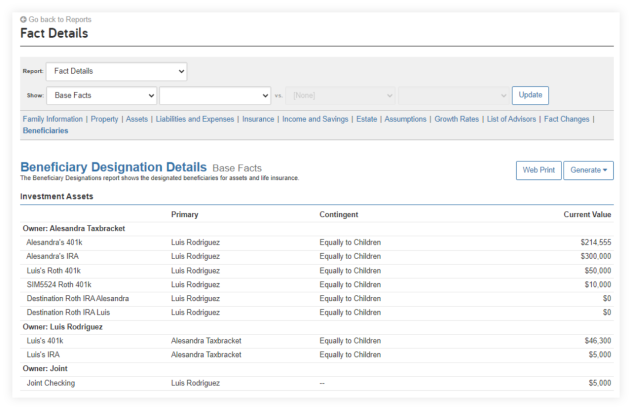
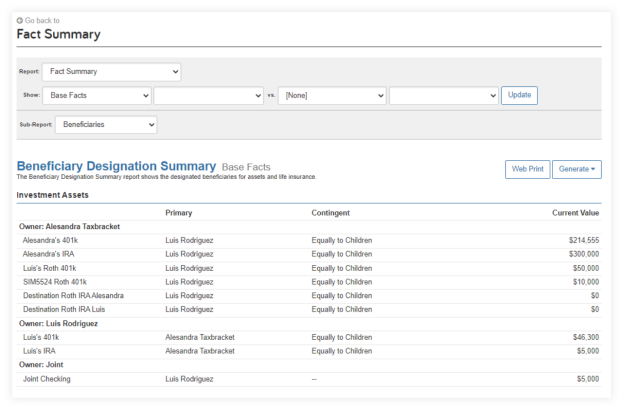
View your changes in the Fact Details report as well as the Fact Summary report.
Released February 28
Save time funding your clients’ educational goals with automated recommendations for dedicating 529 plans.
How Do I Fund an Educational Expense?
Once a 529 plan has been established in Fact Finder under Investments, that plan can be associated with an Education Expense.
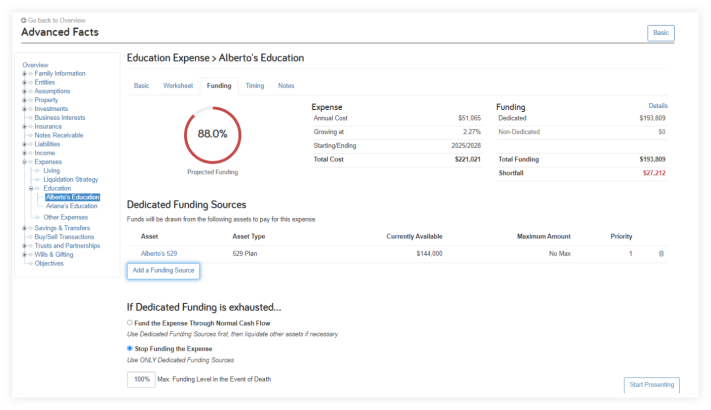
When both are entered in fact finder, the Funding tab for each education expense will automatically suggest the most appropriate 529 plan to dedicate to that education expenses, making your fact entry easier. Remember to add the 529 plan first, and the education expense second.
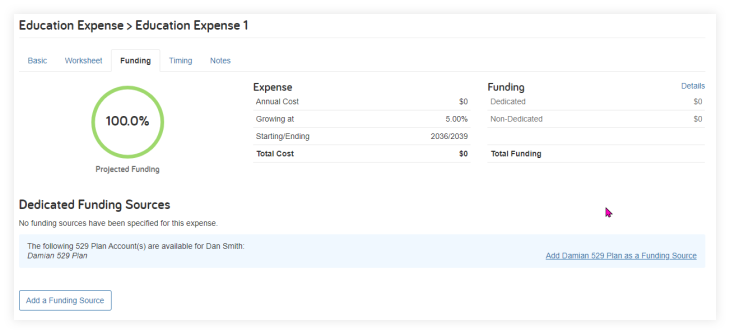
Once the 529 plan is associated with the education expense, the funding will be applied to the expenses and any shortfall or surplus will be calculated.
Released February 28
Simplify the report viewing experience by displaying only the model portfolios currently in use. By displaying only those in use, rather than all possible portfolios, this update removes unnecessary information and reduces overall report length.
Which Reports Will Display Model Portfolios in Use?
The Model Portfolios currently in use within a plan will be displayed in the Assumptions Fact Summary, Assumptions Fact Details, Growth Rates Fact Summary, and Growth Rates Fact Details reports—in both the online view as well as printed reports and presentations.
Where Can I See This Update?
Open Reports, Fact Summary, and then Growth Rates. As you scroll down the page you will see the section for Model Portfolios in Use.
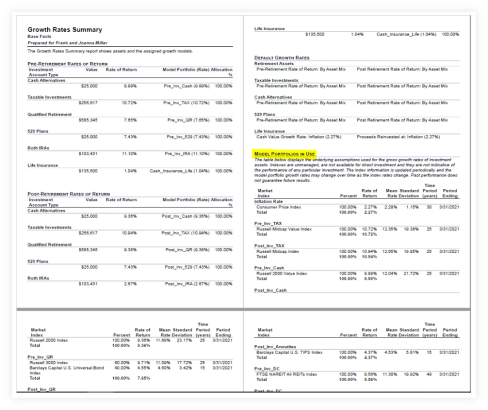
The same display will be available under the Assumptions Fact Summary, Assumptions Fact Details, and Growth Rates Fact Details reports.
Released March 7
Eliminate the need to search for upcoming training opportunities within the eMoney Advisor Blog and Help menu by accessing them and registering via the new Training link in your navigation bar.
Released February 28
In our ongoing effort to provide our clients with the strongest security, we’ve recently upgraded our authentication system. This enhancement is behind the scenes and has no impact to your experience.
Released January 31
Use the new Fill Up Tax Bracket setting and Tax Bracket Chart to quickly show your clients the impact Roth conversions have on their plans in an engaging and interactive way.
Keep reading to learn more about these exciting new features.
⚐ REQUESTED FEATURE
Building on the Roth Conversion Facts added last month, the new Fill Up Tax Bracket setting intuitively converts assets until reaching the breakpoint between marginal tax brackets. This new option makes it easier to identify the value to convert when modeling Roth conversions for your clients.
How Does It Work?
Open the new Roth Conversions facts located under the Savings & Transfers menu. Then open an existing conversion or add a new one to get started. Then open the Conversion Type drop-down menu to access the new Fill Up Tax Bracket option.

When Fill Up Tax Bracket is selected, the simulation calculates the difference between the client’s taxable income and the ceiling of their desired marginal bracket for each year of conversion. The required funds are then transferred from the Accounts to Convert to the designated destination Roth IRA account.
Note: Clients that have Flat Tax enabled will not be able to select the Fill Up Tax Bracket as a conversion type. This includes Traditional and Foundational Planning users. To allow the Fill Up Tax Bracket selection, use the 1040 tax option instead.
If you see two tax rates in the tax bracket drop-down menu, your Tax Assumptions are set to assume that the Tax Cuts and Jobs Act sunset occurs.
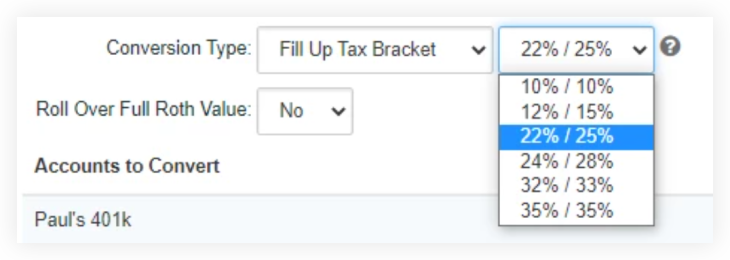
For a more detailed breakdown of the tax brackets, hover over the information icon for the specific dollar amount values.
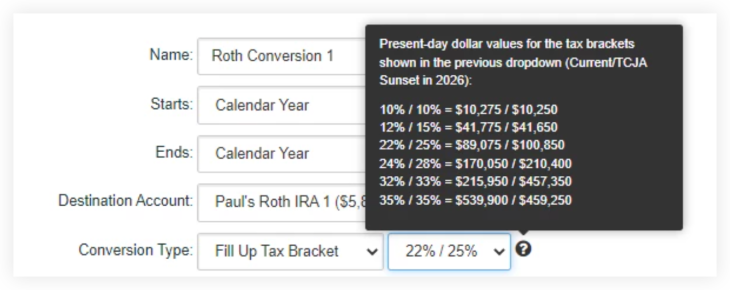
Along with the addition to Fill Up Tax Bracket, we have added a new chart to the Taxes report category in Decision Center that gives you and your clients an engaging way to visualize the impact of Roth conversion scenarios. With the Tax Brackets chart and Fill Up Tax Bracket option, you have a streamlined way to make Roth conversions a natural part of your planning conversations in Decision Center.
Where Can I find the Tax Bracket Chart?
The Tax Bracket view can be accessed within Decision Center by selecting Taxes in the Selected Report menu and then selecting Tax Bracket from the Viewing drop-down.
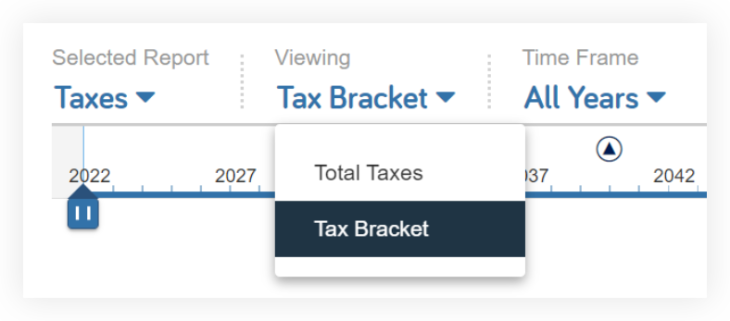
As with many other views in Decision Center, the Tax Bracket page contains a chart, metric cards, and a detailed table. This page is a comparison view similar to the Lifetime Portfolio Value view, where the currently enabled techniques in Decision Center (including the Plan, What-If, and Solvers) are compared to Base Facts.
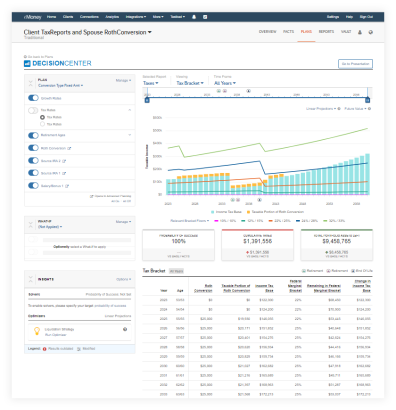
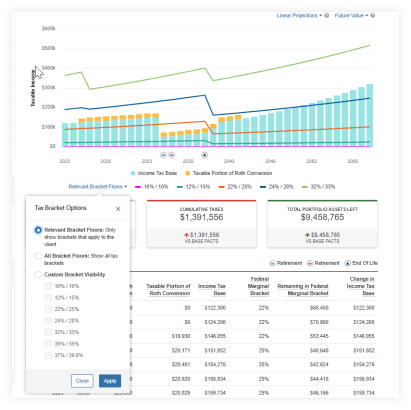
Tax bracket floors are overlaid on the chart to provide a visual indicator of how the taxes associated with Roth conversion(s) relate to applicable tax brackets. The default is to show the relevant bracket floors. You have the option to show all brackets or select a subset of brackets.
Keep an eye out for a best practices blog post next month that will showcase all the recent Roth conversion updates and how to best utilize these new features with your clients.
Released January 31
Your clients can now create a clean list of their most desired accounts on their client site, and hide connected accounts they do not wish to see. This update allows your clients to control which accounts are listed under the Organizer tab on the client site so they can interact more with their connected accounts.

How Can My Clients Start Hiding Accounts?
From the client site, they can select the Organizer and click on Accounts. The client will need to click the All tab to view all accounts they have established on their site, and from that list, they can select which ones they want to be displayed and which they want to hide.
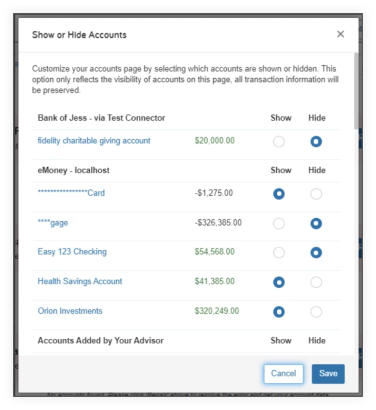
Only clients can hide their accounts. Impersonating advisors will not see the Hide Accounts button.
Please note, that if a client hides accounts on their account organizer page, you will still be able to view those accounts on your Advisor portal.
Any other important information I should know if my client starts hiding accounts?
Released January 31
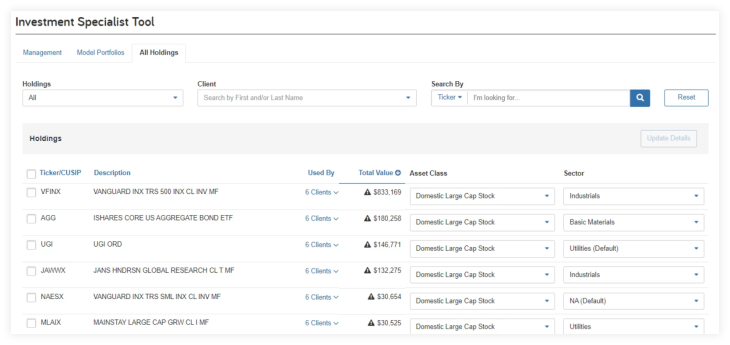
This update simplifies the process of updating the asset class and sector details of securities on the All Holdings page. Now you can easily select multiple holdings on a single page and apply changes in bulk—saving time and increasing productivity.
How Does It Work?
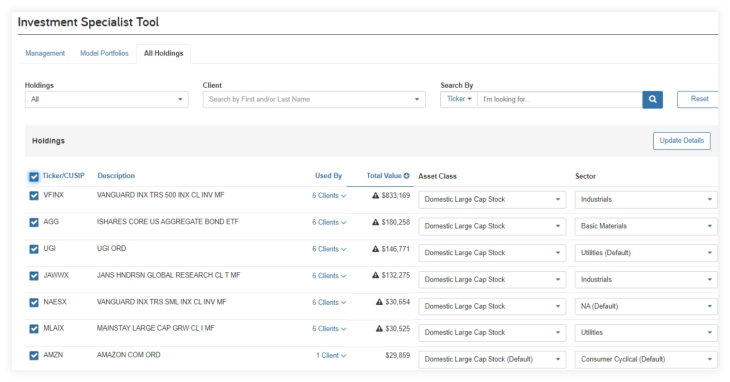
You will now notice each ticker/security listed has a check box before it, as well as a Select All check box at the very top next to the blue Ticker/CUSIP in the header. You can select the tickers you wish to edit or select all, and then click on Update Details in the top right, and begin making your desired changes.
When the Update Details button is selected, a modal appears with the Asset Class and Sector fields.
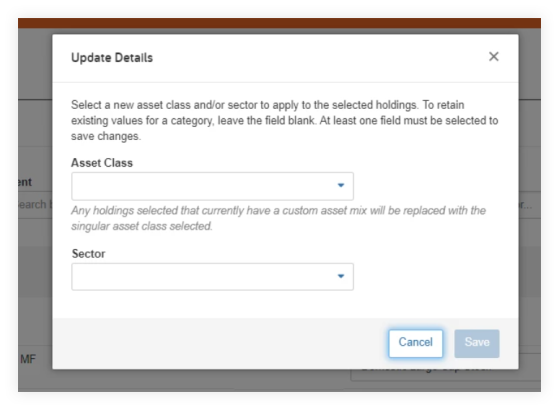
You can now assign a new Asset Class and/or Sector to all the securities selected. The Save button becomes available once a change has been made.
Released February 7
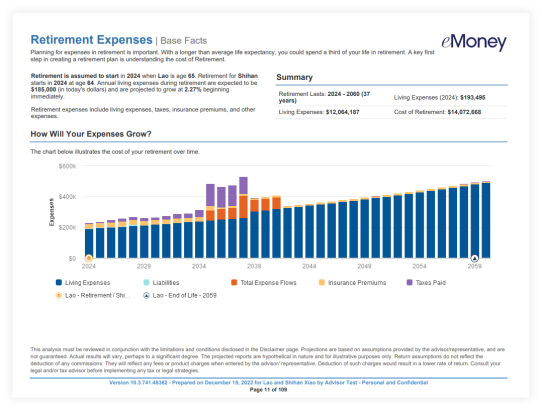
A variety of your reports and presentations will be updated to include new features, improved aesthetics, and enhanced readability—in line with our other enhanced reports. This round of enhancements includes the Assets and Income Tax presentations and Retirement Planning report families.
These changes address user feedback about report aesthetics, readability, and consistency across planning tools, print, and online versions.
Click here to preview a sample of the new Assets, Income Tax, and Retirement Planning reports and presentation.
Where will these updates be visible?
These enhancements will be visible in the online and printed presentations under Plans and under Reports for the Assets, Income Tax, Retirement Planning, and Cash Flow report families.
Keep an eye out for an in-app message under Plans and Presentations when these enhancements go live!
Released January 1
We’ve enhanced our training to suit the educational preferences of our users, beginning with the eMoney Core Concepts training series to provide you with a new way to help you achieve your business goals and improve your learning experience.
For more information on new and upcoming releases, best practices, or eMoney news visit the eMoney Client Blog.